Historical Fuel Trends for Construction Fleets
UK construction fuel rose despite cleaner engines; measure fuel by engine hours, idle time and load with telematics for true performance.
Construction fleets have become more fuel-efficient per machine, but total fuel use still went up. Between 1993 and 2023, UK construction Scope 1 emissions were 30.3% higher, while fossil-fuel use was 25.1% higher. So if I want to judge fleet fuel performance properly, I should look at engine hours, idle time, load and output - not mileage alone.
Here’s the short version:
- Cleaner engines did not cut total fuel demand
- Road diesel use rose 121.8%, while red diesel fell 14.3%
- Idling can account for 15–20% of fuel burn
- Some machines idle for 30–44% of running time
- NRMM use is uneven, with machines averaging 1.04 to 4.45 hours a day
- Mini-excavators make up a big share of the fleet and still shape fuel and emissions patterns
- Fleet telematics gives a better view of fuel cost in £ per engine hour and emissions in tCO2e
If I’m running, buying or reviewing a construction fleet, the main lesson is simple: measure fuel by how machines work, not by how far they travel. That one shift makes old fuel trends much easier to understand.
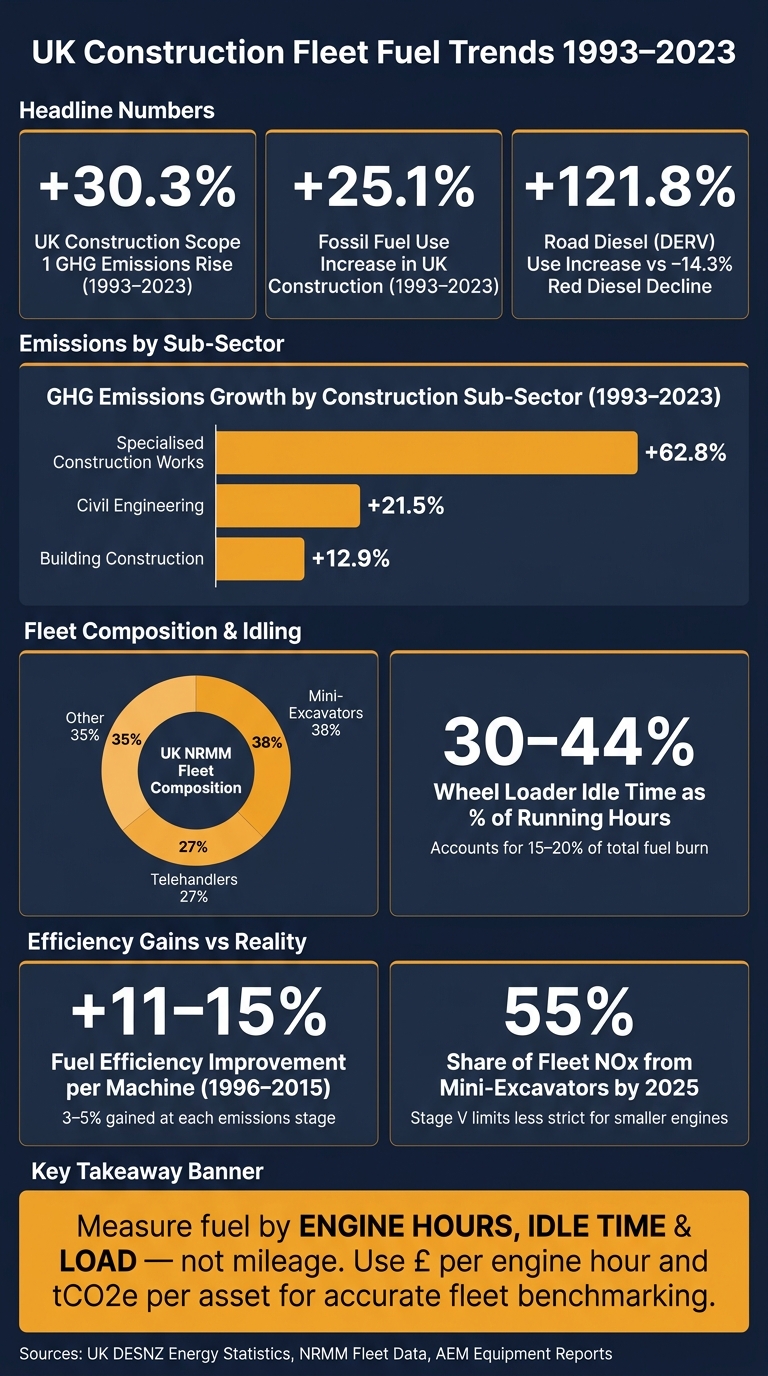
UK Construction Fleet Fuel Trends 1993–2023: Key Stats at a Glance
Fuel Consumption of Construction Equipment I FUEL CONSUMPTION SAVING TIPS I CONSTRUCTION EQUIPMENT
sbb-itb-499a7f0
Historical fuel use in construction equipment and sites
In the UK, construction fuel demand has long followed three things: workload, fleet mix and how hard machines are used. Engines got cleaner as rules tightened, but site activity stayed busy.
That leads to a simple point: cleaner kit did not automatically mean lower total fuel use.
How regulation and technology changed fuel use from the 1990s onwards
From the 1990s onwards, NRMM rules tightened emissions standards, with Stage IV and Stage V cutting NOx from newer equipment in particular. The UK NRMM fleet is expected to see a 58% drop in NOx emissions between 2018 and 2025, even though the total number of machines is only forecast to fall by about 4% over the same period.
That gap tells you a lot. Regulation cleaned up machines far faster than it reduced the size of the fleet.
Fleet mix matters too. Mini-excavators made up 38% of the UK NRMM fleet, while telehandlers accounted for 27%. By 2025, mini-excavators are projected to produce 55% of fleet NOx emissions because Stage V tightened limits less for smaller engines.
So while newer machines were far cleaner than older ones, the make-up of the fleet still shaped overall fuel and emissions outcomes.
UK construction energy use and Scope 1 emissions over time
Fossil-fuel use in UK construction rose 25.1% between 1993 and 2023. The mix of that demand changed a lot over the same period. DERV (road diesel) use more than doubled, up 121.8%, while gas oil (red diesel) fell 14.3%. In plain terms, more of the fuel demand appears to have come from transport and support vehicles linked to projects, not just site plant.
The type of work being done also kept fuel demand high. Specialised construction works saw GHG emissions rise 62.8% between 1993 and 2023, civil engineering rose 21.5%, and building construction rose 12.9%. Those parts of the sector tend to use more fuel, so a shift towards them helped keep total demand up.
Cleaner engines cut emissions per machine, but they did not cut total fleet fuel demand. Small-machine fleets, along with heavier civil and specialised work, kept fuel use high despite gains at machine level. On top of that, construction fleets still had to deal with idling, uneven loads and low utilisation.
Fuel efficiency gains and the limits of improvement
The sector did make real efficiency gains, but construction fleets still used a lot of fuel because site habits changed far more slowly than the engines themselves.
Where fuel efficiency improvements came from
Construction equipment became more fuel-efficient over the past three decades, but the gains came in waves rather than all at once. AEM says equipment was 11–15% more fuel-efficient in 2015 than in 1996, with 3–5% gained at each stage of EU and EPA emissions rules.
A big shift came around 2005, when the industry moved from mechanical engine controls to electronic ones. That change meant combustion could be tuned in real time instead of being stuck with fixed mechanical settings. Put simply, machines got better at matching fuel use to what the job actually needed.
There were gains elsewhere too. Closer coordination between the engine, drivetrain and hydraulics can improve fuel efficiency by 25–40%. On the hydraulic side, pressure-compensated load-sensing systems helped cut wasted energy. Engine downspeeding and continuously variable transmissions also played a part, helping machines keep torque while using less fuel per hour.
Those changes made each machine-hour work harder. But they didn't fix the bigger site-level reasons fuel use stayed high.
Why total fuel use often stayed high despite efficiency gains
One of the biggest reasons is idling. Real-world data shows some wheel loaders idle for 30–44% of running time, which means 15–20% of fuel is burned while the machine is doing no productive work.
There's also a rebound effect. In construction, better efficiency often translated into faster cycles, more output or longer operating hours, not lower total fuel use. A smaller engine that performs like an older, larger one may look like a win on paper, and in many ways it is. But if that machine then works more hours or gets pushed harder, much of the fuel saving disappears. Higher output from smaller engines allowed them to do the work of larger predecessors, absorbing much of the efficiency gain.
That is why fuel trends in construction make more sense when you look at fuel analytics, duty cycle and idle time, not engine efficiency on its own.
Why construction fuel patterns differ from road fleets
Construction fleets don't behave like road fleets. Their fuel use is shaped by duty cycle, not distance.
That one difference changes how you read the data. A machine can become more efficient and still burn a lot of fuel overall, simply because it's working hard for long periods. So if you want to make sense of construction fuel trends, look at machine hours, loads and project output rather than miles.
Idling, stop-start duty cycles and variable loads
Road fleets are usually judged by distance travelled. Construction machinery works in a different way. It can burn fuel while moving slowly or not moving at all, because digging, lifting and holding loads still put demand on the engine. A machine may look idle from the outside, but the engine is still doing the heavy lifting.
That means fuel use shifts with load, idling time and the task in hand. Put simply, distance-based metrics can give the wrong picture.
Use these benchmarks instead:
| Factor | Construction Fleet (NRMM) | On-Road Fleet (Trucks/Vans) |
|---|---|---|
| Fuel metric | Litres per machine hour | Litres per 100 km / MPG |
| Typical use | 1.04–4.45 operating hours/day | Distance-based |
| Best benchmark | Project-based fuel intensity / tonne moved | Distance-based metrics |
These are the measures that make long-term construction fuel trends easier to read.
Different benchmarks for measuring fuel performance
Road measures such as litres per 100 km don't suit construction plant. The metrics that fit are litres per machine hour, litres per tonne moved, and project fuel intensity.
Telematics evidence and sector benchmarks
What telematics data shows about long-term fuel performance
Telematics turns the hour-based benchmarks above into asset-level evidence. Data pulled from engine control modules (ECMs) gives construction fleet operators accurate records for each machine, including engine hours, load factors, idling time and geographical location.
That matters because it strips out a lot of guesswork. Telematics cuts uncertainty in annual hours-of-use estimates to about 18%, compared with the much higher error that comes from fuel-only estimates. It also shows performance by site, project phase or asset class, so operators can see exactly where fuel spend is going.
Utilisation can vary sharply between machine types. Crawler excavators, for example, average far more machine hours per day than compaction equipment. And a machine with low daily hours can still burn plenty of fuel if it spends a large share of that time idling. Telematics brings that pattern into view; a fuel receipt does not.
Construction versus haulage and delivery: a benchmark comparison
The same data also makes the split between construction and road transport plain. In construction, the right measures are engine hours, idling share and tonnes moved. In haulage and delivery, distance-based KPIs make more sense.
That difference is easy to miss, and it leads to bad comparisons. Distance-based KPIs understate gains in mixed fleets because construction equipment does not operate on truck-style duty cycles. A dumper, excavator or compactor simply does not work like an HGV rolling up and down the motorway.
Road transport shows this clearly. Heavy-duty road trucks improved fuel intensity by 43% between 1978 and 2018, but average engine power also rose by 44% over the same period. In plain English, a large share of the gain went into more performance, not lower fuel use.
Construction follows much the same pattern. Engine gains are offset by higher activity levels and the continued use of smaller machines, such as mini-excavators, which sit outside the tightest Stage V limits. Long-term studies show that although engine technology has improved, total construction emissions have still gone up because activity has grown.
Conclusion: key findings for fleet operators
Construction fleets are more fuel-efficient at the machine level than they used to be. But total fuel use and emissions have still risen as activity has increased, and smaller assets such as mini-excavators remain outside the tightest regulatory standards. UK construction Scope 1 greenhouse gas emissions in 2023 were 30.3% higher than in 1993.
For operators, the message is straightforward: track fuel by engine hour, idle time and load, not mileage. Whole-life carbon thinking depends on that shift. Telematics is the practical way to do it, turning long-term fuel patterns into measurable cost in £ per engine hour and emissions in tonnes of CO2e, asset by asset.
FAQs
Why did total fuel use rise?
Total fuel use in the UK construction sector went up for a simple reason: people, materials and kit still had to travel from one site to another.
That rise became even sharper during the post-pandemic jump in activity, which led to a record spike in diesel use in March 2021. Diesel is still a core part of the sector, especially for larger vehicles and heavy equipment. Unlike many other vehicle types, construction machinery is much harder to switch to electric power.
Why isn’t mileage a useful metric?
Mileage tells you far less in construction because it misses the main things that drive fuel use: idling, job-specific tasks, and shifts in how equipment is used.
That’s the key issue. Construction doesn’t run like a fleet on fixed routes. Work on site is uneven, stop-start, and always changing. A machine can burn fuel while standing still, waiting, or sitting on standby.
So if you only look at mileage, you’re not seeing the full picture. In construction, it’s an incomplete way to measure efficiency.
How can telematics cut fuel waste?
Telematics helps cut fuel waste by giving fleet managers real-time data on vehicle performance and driver behaviour. That means they can spot problems fast and deal with them before they turn into a bigger drain on fuel.
It also shines a light on habits that quietly burn through more fuel than they should. When businesses track idling, speeding, and harsh braking, they can pick up on wasteful patterns and work to fix them. On top of that, historical data helps flag seasonal trends and mechanical issues, which keeps vehicles and equipment running more efficiently.