AI Data Analytics for Fleet Anomaly Detection
How joined telematics and AI spot idling, fuel spikes, route drift and theft to reduce breakdowns and waste.

If I want fewer breakdowns, less fuel waste, and earlier theft alerts, I need AI to spot odd fleet behaviour before it turns into a bigger problem.
Here’s the short version: AI looks at GPS, engine, fuel, trip and driver data, learns what normal looks like for each vehicle and route, then flags patterns that drift away from that baseline. That helps me act on issues like idling, fuel spikes, route drift, harsh driving, fault-code changes and out-of-hours movement without relying on one fixed rule for every van.
At a glance, this article shows me how to:
- define fleet anomalies in plain terms
- use joined telematics data instead of one signal on its own
- choose between supervised, unsupervised and semi-supervised AI methods
- turn raw data into alerts with anomaly scores
- use AI for maintenance, driver risk, fuel control and theft detection
- track results through false positives, lead time, downtime avoided and response time
- build trust with alerts that explain what changed, when, and why
- support the whole setup with clean telematics data, geofences, driver IDs and dual-tracker inputs
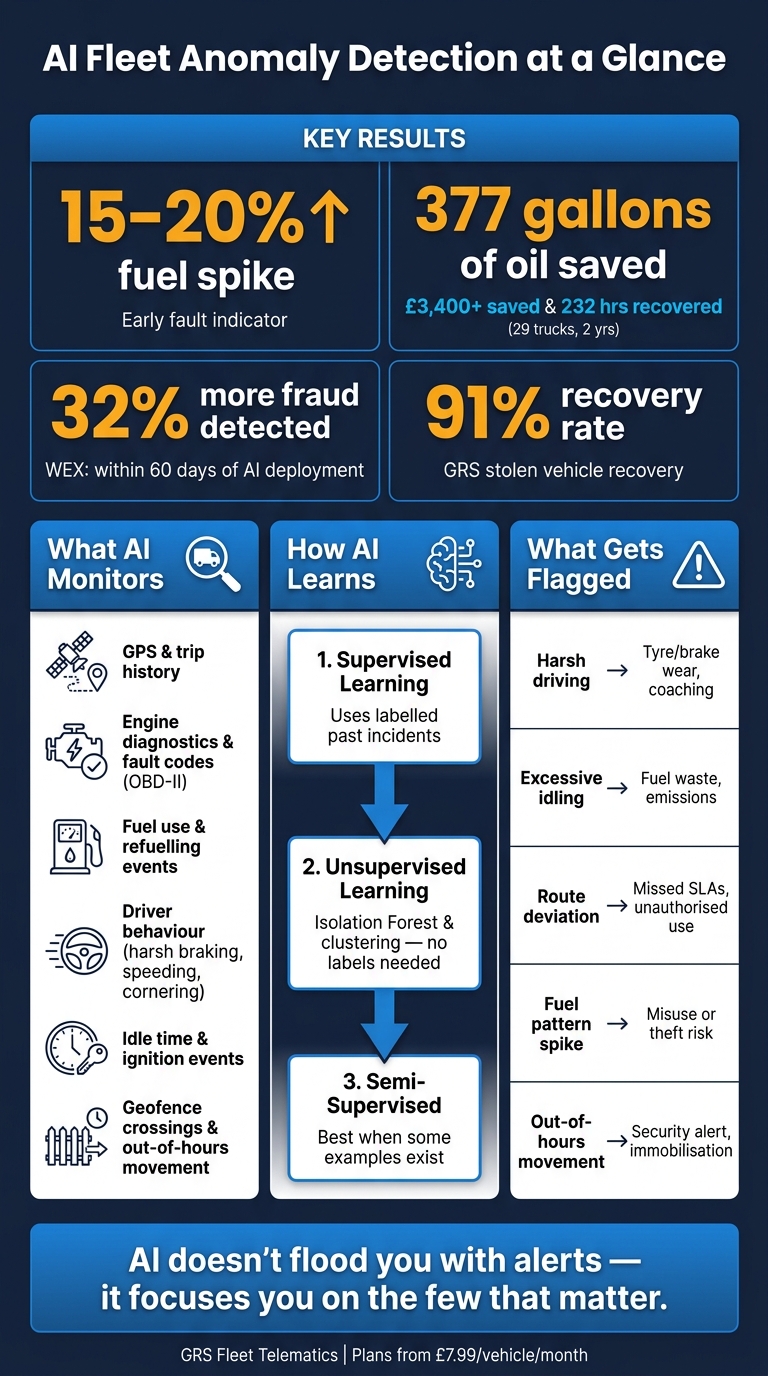
A few points stand out straight away:
- A 15–20% jump in fuel use over several days can point to a problem.
- One fleet cut oil use by 377 gallons, saved more than £3,400, and got back 232 hours of vehicle readiness over two years.
- WEX reported a 32% increase in fraud detection over 60 days after using AI models.
- GRS states a 91% stolen-vehicle recovery rate.
The main idea is simple: AI is not there to flood me with alerts. It is there to help me focus on the small number of events that need action. The rest of the article explains how that works in day-to-day fleet use, and what I need in place to make it useful.
AI Fleet Anomaly Detection: Key Data Types, Methods & Results
How AI Anomaly Detection Works with Fleet Telematics Data
The Main Fleet Data Sources AI Analyses
After the normal-behaviour baseline is set, the next step is simple: give the model the right telematics signals. AI anomaly detection works best when it looks at joined data, not one reading on its own.
The main inputs usually include GPS and trip history, driving behaviour, idle time, ignition events, geofence crossings, engine diagnostics, fault codes, fuel use and refuelling times. In UK reporting, this should be shown in miles, litres and 24-hour time.
Here’s why joined data matters. An odd fuel reading on its own might not mean much. But pair it with abnormal idle time and a route deviation, and the signal gets a lot stronger. That combination is far more likely to point to something that needs attention than any single metric by itself.
Once the data is joined and cleaned, the model choice comes down to one thing: how much incident history the fleet already has.
The Core AI Methods Used to Spot Unusual Behaviour
Supervised learning works well when a fleet has enough labelled examples of past incidents, such as confirmed theft attempts, verified maintenance failures and similar events. The model learns those patterns, then flags similar behaviour later on. The catch is that most fleets don't have enough labelled incidents, so this approach tends to work better only after a solid incident record is in place.
Unsupervised learning is often the most practical place to start. Methods such as Isolation Forest and clustering learn what normal looks like from the data itself, then flag observations that don't fit. That means there is no need to label incidents in advance.
Autoencoders, including LSTM variants for time-series data, learn normal sequences and flag high reconstruction errors as anomalies. Semi-supervised methods sit between the two. They are useful when a fleet has some confirmed examples, but not enough to train a fully supervised model.
From Data Collection to Alert Generation
The path from raw telematics feed to an alert people can act on follows a clear pipeline.
Data comes in from trackers and vehicle systems. It is then cleaned to remove GPS noise, missing values and duplicated records. After that, the data is grouped into useful units such as trips, shifts or daily summaries, and turned into features the model can work with.
Those features might include:
- average speed per route
- idle minutes per hour
- litres per 100 miles
- harsh braking event counts
- time-of-day deviations from the vehicle's normal pattern
The model then compares each observation with the learned baseline and assigns an anomaly score. Events with high scores are turned into alerts that include the vehicle, time, location, metric and deviation. That context helps managers move fast on maintenance, safety, dispatch or security issues.
These alerts feed the maintenance, safety and security use cases covered next.
sbb-itb-499a7f0
How Stratio Built AI-Powered Predictive Maintenance
The Fleet Problems AI Anomaly Detection Can Solve
Once anomaly scores are set up, the next job is simple: point them at the fleet issues most worth fixing. In practice, the biggest pay-offs tend to come from maintenance, driving risk, fuel control and security.
Vehicle Health and Predictive Maintenance Anomalies
Most mechanical faults don’t come out of nowhere. There are usually small warning signs first. Coolant temperature might creep up a bit earlier on each trip. A fault code may show up after longer idle periods. Oil pressure might slip below that vehicle’s usual range. Those slow changes are easy to miss, and mileage- or time-based service plans aren’t built to catch them.
AI looks for these patterns across OBD-II fault codes, coolant temperature, oil pressure, battery voltage, engine load and fuel consumption. One high reading on its own may not mean much. But a slow temperature climb, paired with repeat fault codes and higher fuel use, starts to tell a different story. That kind of pattern can be flagged before a breakdown happens.
One fleet study used sensor data and prognostic models to optimise oil-change intervals, saving 377 gallons of oil, more than £3,400 in material costs and 232 hours of vehicle readiness over two years for 29 trucks. For UK fleet managers, that means fewer roadside failures, better workshop planning and less unplanned repair spend.
Driving Risk, Fuel Misuse and Route Anomalies
The same pattern-based approach can also surface unsafe driving and fuel loss. These are often some of the easiest issues to act on because the data is already there: accelerometer readings, GPS speed traces, engine-on time, fuel level and movement outside normal hours.
AI compares current behaviour with the driver’s own history, the vehicle’s normal pattern and peer routes. One harsh braking event on a busy city road probably isn’t a big deal. But repeated harsh braking, speeding and cornering on the same route, sitting above the peer-group baseline again and again, points to a coaching issue - and a cost issue.
The table below shows the main anomaly types, the signals behind them and what early detection can change.
| Anomaly Type | Data Signals | Detection Logic | Impact on Fleet Operations |
|---|---|---|---|
| Harsh braking / acceleration / cornering | Accelerometer, speed trace, GPS | Repeated clustering above peer baseline | Increased brake/tyre wear, higher collision risk, coaching opportunity |
| Speeding | GPS speed, road-speed context | Sustained or repeated over-limit events by route type | Safety risk, fuel waste, compliance concerns |
| Excessive idling | Engine-on time, zero-speed duration, fuel burn | Idle time above route or vehicle norm | Wasted fuel, higher emissions, shortened service life |
| Unusual detours / route deviations | GPS trail, planned route, stop sequence | Deviation from expected corridor or job sequence, including movement outside normal hours | Missed SLAs, unauthorised use, higher mileage |
| Suspicious fuel patterns | Fuel level, refuelling events, mileage, engine hours | Fuel use inconsistent with distance or duty cycle | Potential misuse, leakage or fuel theft |
Idling, speeding and route inefficiencies are major drivers of high fleet fuel costs. Spotting them through anomaly detection - instead of waiting for a monthly report - lets managers respond within days, not weeks. That could mean driver coaching, route changes or tighter fuel control.
Security, Theft and Unauthorised Vehicle Movement
The same telemetry can also flag unauthorised movement before a vehicle is gone. Security anomalies need a faster response because the cost of missing one can be immediate.
Theft often shows up as a chain of signals: unusual ignition, route deviation, geofence exit, tamper signal or a communication gap. A hybrid setup that combines fixed rules for out-of-hours movement with geospatial anomaly detection is stronger than depending on a single alarm.
A depot departure outside working hours, or movement that breaks the day’s planned job sequence, should be checked. The goal is to catch unauthorised use early and keep tighter control over vehicle movement.
These alerts only work if the data underneath them is clean, consistent and easy to audit.
Data Requirements, Model Governance and Reporting
Anomaly alerts are only as good as the data feeding them. If the inputs are messy, the output gets messy too: more noise, missed risks and a false sense that everything’s under control. So the next job is simple in theory, hard in practice: make sure alerts sit on data you can trust, then check them against what’s happening out on the road.
What Good Fleet Data Looks Like
AI anomaly detection works best when data is clean, steady and lined up by timestamp. In practice, that means telematics devices sending data at regular intervals, GPS trails without impossible jumps, engine readings that stay within believable ranges, and ignition status that matches actual vehicle movement. If a van appears to be driving with the ignition off, something’s off - and it may be the data, not the driver.
Gaps matter too. When a vehicle drops signal in a rural area or a tracker sends delayed timestamps, those gaps need to be handled on purpose, not quietly patched over. Short dropouts can often be smoothed. Longer ones should be marked as low-confidence periods, so the model doesn’t fire alerts on half the story.
A suspicious fuel-card transaction matters only when it is tied to location and shift data.
How to Measure Whether Anomaly Detection Is Working
Once alerts go live, the test isn’t model theory. It’s fleet impact. You need to track things that connect alerts to day-to-day results, such as:
- false positives
- lead time
- breakdown reduction
- downtime avoided
- security response time
Those measures show whether the system is helping the business or just producing more dashboards.
WEX reported a 32% increase in fraudulent transaction capture over a 60-day period after deploying AI models, alongside a similar improvement in false-positive accuracy.
That kind of before-and-after view matters far more than abstract model scores. Fleet managers need proof in confirmed incidents, saved time and fewer disruptions if they’re going to back the spend and keep tuning the system.
It also helps to log every alert by outcome: confirmed, false alarm, under review, or action taken. That log gives teams something solid to work with. They can spot model drift, adjust thresholds and check whether performance is slipping. Version control, scheduled reviews and retraining also matter, especially when routes, demand or vehicle mix shift. And for high-impact alerts, there should always be a human check before anything is escalated.
Why Explainable Alerts Build Driver and Manager Trust
Alerts only help when people can see why they appeared. A vague “anomaly detected” message is easy to ignore. An alert that names the vehicle, behaviour, route and time is much harder to brush aside.
Fleetio notes that trust in predictive maintenance depends on consistent accuracy, clear explanations for alerts and follow-through when technicians report false positives.
Each alert should show what changed, when it changed and which signals triggered the flag. The best ones do this in plain English, backed up with proof such as a trend chart or event log. A confidence score helps as well. It gives managers a way to sort urgent issues from lower-risk ones and makes driver coaching a lot more grounded in facts than guesswork.
Applying AI Anomaly Detection in UK Fleets with GRS Fleet Telematics
How GRS Fleet Telematics Supports the Data Layer for Anomaly Detection
Once model behaviour and reporting are set, the next job is pretty simple to define, even if it takes care to get right: feed the system clean, steady data. That’s where GRS Fleet Telematics comes in.
For UK fleets, that matters a lot. Multi-drop routes, mixed-road driving and take-home vans all produce different patterns, so “normal” won’t look the same across every vehicle or driver. The system has to learn those patterns at that level, not treat the whole fleet as one big average.
Real-time tracking, trip history, geofences, driver behaviour and start/end times all feed into anomaly detection. Those inputs help models spot actual deviations in UK van fleets, not just random noise. When geofences, driver IDs and thresholds stay consistent, alerts tend to be more dependable and much easier to explain to managers and drivers alike.
For fleets with a strong security focus, the clearest signals often come from layered tracking and movement data. GRS Fleet Telematics uses dual-tracker technology, with two independent tracking devices fitted to each vehicle. If one device drops out, the other keeps location data flowing and gives the system more confidence in what it is seeing.
That setup makes it easier to spot warning signs such as:
- tracker locations that don’t match
- signal loss from one device while the other keeps reporting
- vehicle movement detected while the ignition is off
Using Dual-Tracker and Immobilisation Data for Stronger Security Alerts
AI models can be trained to spot patterns that look like theft. That might mean a van leaving the depot in the early hours, movement without a recognised driver ID, or fast travel towards a high-risk area. One signal on its own may not mean much. But when several appear together, the system can escalate a priority security alert.
At that point, a trained person reviews the evidence. If the vehicle is stationary and it is safe to act, remote immobilisation can then be triggered. That human check matters. Immobilisation should stay human-approved and safety-checked.
GRS Fleet Telematics' 91% recovery rate for stolen vehicles shows what can happen when fleets spot anomalies early and respond without delay.
Conclusion: Turning Fleet Data into Earlier Warnings and Better Decisions
The same data streams support day-to-day operational alerts and fast security response. AI anomaly detection can help UK fleets:
- catch vehicle health issues before they turn into breakdowns
- flag fuel misuse and route irregularities before they become routine
- identify risky driving before it leads to incidents
- detect theft attempts before a van disappears
None of this works without a steady and dependable flow of telematics data underneath it.
GRS Fleet Telematics plans start from £7.99 per vehicle per month, covering real-time tracking, driver behaviour monitoring, geofencing and platform access. Those are the core building blocks for a serious anomaly detection workflow. For fleets ready to get moving, the next step is to audit device coverage and start with the anomaly types most likely to pay off first.
FAQs
How much fleet data do I need to start?
You don’t need to process every terabyte of fleet data from day one. Start small with targeted data collection and a pilot programme covering 10% to 20% of vehicles over 2 to 4 weeks.
That gives your team room to check data accuracy, test system reliability, and sort out integration issues before a full rollout. It also keeps the early stage practical instead of turning it into a massive IT job.
A simple approach works best at first:
- Begin with basic alerts
- Check that the data is clean and consistent
- Fix any gaps between systems
- Expand into more advanced analytics as your team gets used to the setup
That way, you’re learning on a smaller sample before applying the system across the full fleet.
What causes false anomaly alerts?
False anomaly alerts usually happen when telematics systems don't have enough context to tell the difference between routine events and actual problems. That’s why older systems often flag necessary actions, like emergency braking to avoid a crash. Over time, that can lead to alert fatigue.
AI-driven platforms like GRS Fleet Telematics cut down on this noise by looking at the bigger picture. They analyse context such as traffic, weather, road conditions, and driver history, so normal variation is less likely to be flagged as a critical anomaly.
Which anomalies should I prioritise first?
Put anomalies that point to serious safety or security risks at the top of the list, because they need action straight away. Focus on the triggers that matter most: critical engine faults, brake failures, unauthorised engine starts, and geofence breaches.
Use alert tiers to split routine maintenance warnings from urgent faults, so your team can react fast where it counts. GRS Fleet Telematics supports this with tracking and diagnostic tools.