How Predictive Analytics Improves Route Efficiency
How machine learning and live telematics cut fuel, improve on-time deliveries and reduce planning time for UK fleets.

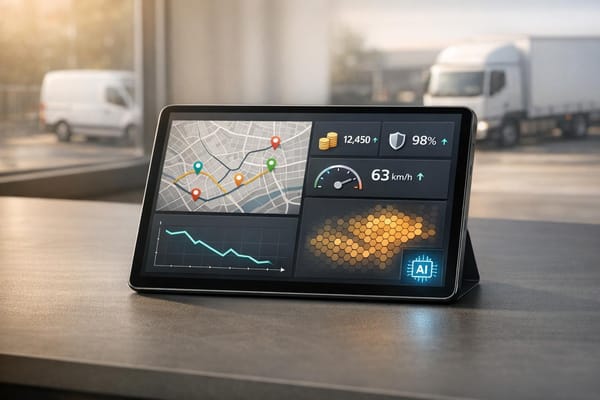
Predictive analytics is transforming delivery route planning by using historical data, real-time updates, and machine learning to create efficient, dynamic routes. This approach helps businesses in the UK cut costs, save time, and improve delivery reliability by accounting for factors like traffic, weather, and vehicle performance.
Key benefits include:
- Fuel Savings: Companies like UPS save millions annually by reducing unnecessary mileage.
- Improved Delivery Times: AI-powered routing has increased delivery capacity by up to 25% and on-time deliveries by 15%.
- Enhanced Safety: Smarter routes reduce driver fatigue and improve road safety.
To implement this, fleet managers need reliable telematics systems, quality data, and employee training. By tracking metrics like delivery time, fuel costs, and vehicle utilisation, businesses can measure success and refine their systems over time. While initial costs may seem high, ROI typically appears within 6–12 months through savings and efficiency gains.
What Is AI-Driven Route Planning? - Talking Tech Trends
How Predictive Analytics Works for Route Planning
Predictive analytics transforms raw data into actionable route suggestions by combining multiple data streams with machine learning. These systems continuously gather and process information, using algorithms to generate routes that adjust to ever-changing conditions. By understanding how this process works, fleet managers can better appreciate the efficiency gains these systems bring. This technical groundwork highlights the role of specific data sources and analytical models in improving route planning.
At its core, predictive analytics integrates live telematics data with historical trends and external factors. Fleet tracking systems monitor vehicle activity, fuel use, and engine performance while also incorporating updates on traffic, weather, and delivery requirements. These diverse data streams feed into analytical models, which identify patterns, anticipate conditions, and calculate the best possible routes.
Data Sources for Predictive Analytics
For predictive analytics to function effectively, it relies on a wide array of interconnected data sources. Each type of data provides unique insights, helping systems build a comprehensive understanding of fleet operations and the external factors that influence route efficiency.
- Real-time telematics data captures details like vehicle location, speed, fuel use, and engine diagnostics as vehicles move along their routes. GRS Fleet Telematics, for example, uses a dual-tracker setup: a primary hardwired tracker connected to the vehicle's power system and a hidden backup Bluetooth tracker that operates independently. This ensures uninterrupted data collection, even if one tracker fails, maintaining the accuracy needed for reliable predictions.
- Traffic data combines live updates with historical congestion patterns to predict where and when traffic is likely to build up. This allows systems to suggest alternative routes before drivers encounter delays.
- Weather conditions play a major role in delivery times and safety. Predictive systems incorporate both forecasts and real-time weather updates to account for how rain, snow, or wind might impact travel.
- Historical trip records provide context on driver behaviour, typical journey times, and overall performance across various routes and times of day. By analysing long-term data, systems can identify trends that inform future planning.
- Delivery constraints include factors like customer time windows, shipment size, vehicle capacity, and driver availability. These practical considerations are balanced against the need for route efficiency.
- Driver behaviour data - such as speed monitoring and eco-driving analytics - offers insights into how driving styles affect fuel use and travel times. Systems can identify which drivers are consistently more efficient, using this information to refine predictions and highlight potential training needs.
Analytical Models Used in Route Planning
Once the data is collected, a range of analytical models work together to turn it into optimised route recommendations. Each model focuses on a specific challenge, and their combined outputs create solutions that balance multiple priorities.
- Time series forecasting models analyse historical traffic and demand patterns to predict future conditions. These models help systems plan deliveries during less busy periods or add extra time to routes during peak hours.
- Regression analysis identifies relationships between variables, improving the accuracy of predictions. For instance, it might show that rainy weather extends delivery times or that older vehicles consume more fuel, helping refine planning under similar conditions.
- Clustering algorithms group similar delivery routes, customer locations, or patterns to uncover inefficiencies. For example, clustering might reveal that deliveries to the same postcode could be consolidated or that specific vehicles perform better on certain routes.
- Anomaly detection models flag unusual patterns or disruptions before they escalate. These models establish a baseline for normal operations and alert managers to deviations, like a sudden spike in a vehicle’s fuel consumption, which could indicate a mechanical issue.
- Vehicle Routing Problem (VRP) frameworks provide the mathematical backbone for route optimisation. Traditional VRP models consider factors like vehicle capacity, time constraints, and distance, but when combined with machine learning, they become more adaptable, offering multiple solutions based on real-time conditions.
- Decision trees and neural networks handle complex, multi-dimensional data to predict traffic and customer behaviours. These models excel at analysing intricate relationships between variables, producing more accurate predictions than simpler methods.
The true strength of predictive analytics lies in how these models work together. For instance, time series forecasting might predict traffic trends, regression analysis could estimate weather-related delays, clustering might streamline delivery schedules, and VRP frameworks would optimise routes - all while anomaly detection keeps an eye out for unexpected disruptions. This collaborative approach ensures that route recommendations remain effective and adaptable, even as conditions shift throughout the day.
Step-by-Step Guide to Implementing Predictive Analytics
When it comes to translating predictive models into real-world improvements, having a structured plan is crucial. Whether you're managing a fleet of ten vehicles or a hundred, starting with a clear picture of your current capabilities helps avoid costly mistakes and ensures the technology delivers the results you're aiming for.
Assess Your Fleet's Data Capabilities
Before diving into predictive analytics, take a hard look at your fleet's data collection tools. Start with your telematics system. Does it provide live GPS updates with accurate speed and status information? Can it track driver behaviour, such as speeding, hours worked, or eco-driving habits? These are the building blocks for any predictive model.
Next, evaluate your reporting systems. Are they tracking essential metrics like fuel usage, maintenance schedules, and vehicle performance? If your data collection is limited to basic location tracking, you'll need to upgrade. For instance, GRS Fleet Telematics uses a dual-tracker system to ensure uninterrupted data collection - a feature that's key for maintaining the data consistency predictive models thrive on.
Make sure your data is easy to access through web portals or mobile apps, and check your storage capacity. Predictive analytics requires processing large volumes of information, and insufficient storage can slow things down. Also, identify any gaps in your data. Are historical delivery records incomplete? Is traffic pattern data missing? Spotting these issues early allows you to address them proactively.
Finally, consider your team's technical abilities. Do you have in-house expertise to manage data integration, or will you need outside help? A thorough assessment at this stage sets the foundation for a smoother implementation process.
Once you've taken stock of your data capabilities, the next step is integrating real-time and historical data to build a robust analytical framework.
Integrate Real-Time and Historical Data
Combining real-time and historical data is essential for creating a comprehensive analytical system. Start with real-time inputs like traffic and weather data, which directly impact delivery routes and timings. For example, live traffic updates paired with historical congestion patterns enable the system to predict delays and suggest alternative routes. In the UK, where weather conditions like rain or snow frequently disrupt schedules, incorporating both forecasts and real-time updates is critical.
Layer in historical delivery data from your fleet management system. This could include past route performance, delivery times, and fuel usage under different conditions. Merging these data streams allows predictive models to identify patterns and make accurate recommendations.
Take a phased approach to integration. Begin with a few core data sources, such as traffic and delivery history, and validate their accuracy before expanding to additional inputs like vehicle telemetry (engine health, fuel efficiency) or driver behaviour. This step-by-step method prevents system overload and gives your team time to adapt.
Before feeding data into the predictive models, conduct a quality audit. For instance, review a sample of 100 past deliveries to ensure recorded times, distances, and fuel consumption match actual performance. Address inconsistencies like duplicate entries or mismatched records. Also, set up validation rules to flag anomalies, such as delivery times that fall outside expected ranges. For UK operations, ensure all measurements are in kilometres and use a 24-hour clock format for time.
With data integration in place, focus on training your team to make the most of the new system.
Train Teams and Monitor Implementation Progress
Even the best technology won't deliver results if your team doesn't know how to use it. Start with the basics: explain how machine learning models analyse past data to predict future conditions, and show how real-time alerts differ from traditional route planning.
Use practical, relatable examples. For instance, demonstrate how the system might suggest rerouting a van to avoid a congested motorway or predict a delay due to adverse weather. Interactive training sessions can help dispatchers and drivers understand the dashboard, interpret confidence levels in predictions, and decide when local knowledge should override system recommendations.
Address any resistance early. Highlight the benefits, like reduced driver fatigue from optimised routes, improved safety through hazard avoidance, and even performance bonuses tied to better metrics. Involve your team in the process by holding focus groups to gather their feedback and address concerns.
Consider starting with a pilot programme involving a small group of participants. Early successes, like saving 20 minutes by avoiding a traffic jam, can build trust and enthusiasm across the team. Share these wins widely to demonstrate the system's value in real terms.
Set clear protocols for responding to alerts. For example, severe weather warnings might require immediate action, while other notifications could be informational. Establish a feedback loop so dispatchers can report when predictions were accurate or missed the mark. This helps refine the model over time.
Track progress with clear metrics. Focus on key performance indicators like:
- Delivery time reductions (aim for a 15–20% improvement)
- Fuel cost savings (target a 10–15% decrease)
- On-time delivery rates
Measure efficiency by monitoring kilometres driven per delivery and reducing empty trips. Compare fuel consumption per kilometre before and after implementation to quantify gains. Start with a baseline for each metric, then review results monthly for the first three months and quarterly after that. Use consistent units like pence per litre for fuel and kilometres for distance.
Smaller fleets (10–25 vehicles) can expect implementation to take 2–3 months at a cost of £3,000–£8,000. Medium fleets (26–100 vehicles) may need 3–4 months and £8,000–£20,000. For large fleets (100+ vehicles), plan for 4–6 months and costs exceeding £20,000. ROI typically appears within 6–12 months, thanks to fuel savings, shorter delivery times, and better vehicle utilisation. Budget an additional 10–15% as a contingency for unexpected challenges.
A phased rollout is often the safest bet. Start with one depot or region, measure results, and then expand. This approach minimises risk and allows your team to gain experience before going all in.
Finally, celebrate early wins. If the system predicts a traffic jam and saves a driver 20 minutes, share that success story with the team. Real-life examples like these are far more convincing than theoretical benefits and help maintain momentum throughout the implementation process.
Measuring and Evaluating Route Efficiency Improvements
After implementing a predictive analytics system, the next step is to measure its impact effectively. This means tracking the right metrics to verify return on investment (ROI) and identify areas for further improvement. By establishing clear baselines before implementation, you can monitor key performance indicators (KPIs) that reflect genuine operational changes. Once these metrics are in place, the data collected can drive ongoing refinements.
Key Metrics to Track
One of the most telling indicators of route efficiency is delivery time reduction. Calculate the average time taken per delivery before and after implementing predictive analytics. For example, if the average delivery time drops from 45 minutes to 38 minutes, you’ve achieved a 15.6% improvement - well within industry benchmarks.
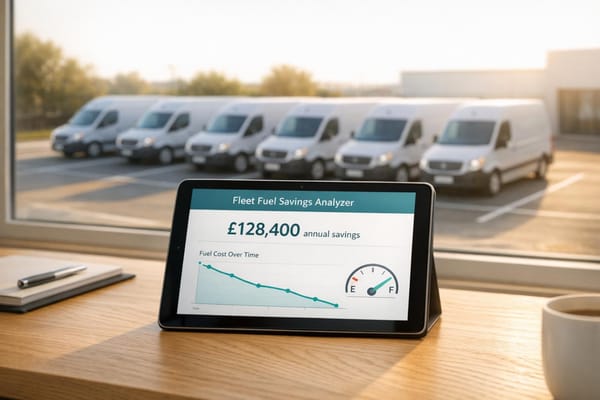
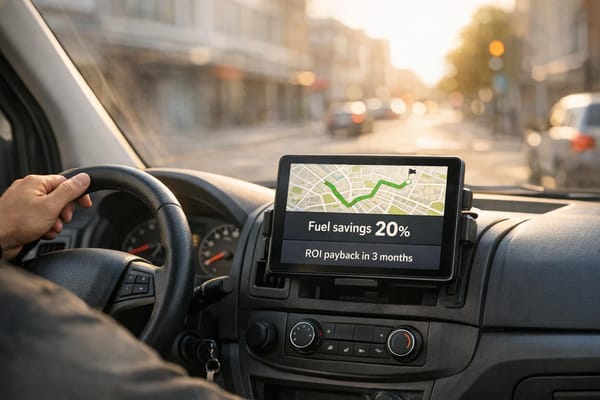
Fuel consumption is another critical metric. Track total fuel usage and cost per kilometre. For instance, reducing costs from £0.18 per kilometre to £0.16 represents an 11% improvement. In the UK, where fuel prices can swing significantly, even small percentage gains can save thousands of pounds annually. Many companies report double-digit reductions in mileage after adopting AI-driven routing solutions.
On-time delivery rates (often referred to as on-time-in-full or OTIF) measure service reliability and customer satisfaction. If your baseline OTIF is 82% and improves to 92%, that 10-percentage-point gain will resonate with customers. For example, C.H. Robinson's Navisphere Vision platform has helped clients increase on-time delivery rates by 30% through predictive analytics.
Cost per delivery provides a comprehensive look at efficiency. Divide total operational costs (fuel, labour, vehicle maintenance, tolls) by the number of deliveries. A reduction from £8.50 to £7.40 per delivery might seem small, but when multiplied across thousands of deliveries, it translates into significant annual savings.
Vehicle utilisation rates reveal how effectively your fleet is being used. This metric tracks the percentage of time vehicles are engaged in productive deliveries versus idle or empty running. Better utilisation not only boosts efficiency but can also reduce the size of the fleet needed to maintain service levels.
Planning time reduction is another area to monitor. Some logistics companies have seen planning time drop by 75% after adopting AI for route optimisation, along with a 12% increase in daily delivery capacity. For instance, if dispatchers currently spend three hours daily planning routes, cutting this to 45 minutes frees up time for other tasks.
Lastly, track ETA accuracy. If predicted delivery times consistently align with actual arrival times within a 10-minute window, it’s a sign that your predictive models are performing well. Any deviations signal that updates are needed.
Here’s a quick summary of key metrics:
| KPI | What to Measure | Realistic Target |
|---|---|---|
| Delivery Time Reduction | Average minutes per delivery | 15–20% improvement |
| Fuel Costs | Pence per kilometre | 10–15% reduction |
| On-Time Delivery Rate | Percentage of OTIF deliveries | 5–10 percentage points higher |
| Cost Per Delivery | Total cost divided by deliveries | 10–15% decrease |
| Vehicle Utilisation | Productive time vs. total time | 10–15% improvement |
| Planning Time | Hours spent on route planning | 50–75% reduction |
Targets should reflect your starting point. Fleets already operating efficiently may see smaller gains, while those with inefficiencies can expect more substantial improvements. Setting incremental goals - like a 5% improvement in year one and 8% in year two - helps maintain momentum and keeps teams motivated.
Using Data to Drive Continuous Improvement
These metrics do more than measure success - they guide ongoing improvements. Predictive analytics isn’t a "set it and forget it" solution. Regular refinements are essential to keep models accurate as conditions evolve.
Start with a monthly review cycle for the first three months, then transition to quarterly reviews once operations stabilise. Compare actual performance against predictions to spot areas where the models fall short. For example, if a predicted 30-minute journey consistently takes 38 minutes, investigate the cause - perhaps traffic patterns have shifted or new roadworks have emerged.
Keep a close eye on traffic pattern deviations. UK roads are in constant flux, with new developments, altered traffic light timings, and seasonal changes all affecting travel times. When real-world congestion differs from predictions, update the model with fresh data. This is especially important in urban areas where conditions change frequently.
Assess weather impact accuracy regularly. If the system predicts a 15% delay due to rain but the actual impact is closer to 25%, the weather coefficients in your model need adjustment. Given the unpredictability of UK weather, frequent updates are crucial.
Don’t overlook driver feedback. Drivers encounter real-world conditions that data alone can’t capture, such as unexpected road closures or customer access issues. Weekly surveys or monthly meetings where drivers report impractical route recommendations or inaccurate ETAs can provide invaluable insights for refining the system.
Analyse fuel consumption variance by route type and vehicle class. If certain routes consistently use more fuel than predicted, dig deeper - perhaps the terrain is more challenging or specific vehicles are underperforming. These insights can fine-tune predictions and highlight vehicles needing maintenance.
Review customer availability patterns to reduce failed delivery attempts. If certain postcodes frequently have unavailable customers during predicted time slots, adjust the model to reflect actual availability. This improves first-time delivery success rates and reduces wasted journeys.
Establish a feedback loop for dispatchers to flag prediction accuracy in real-time. For instance, if a severe weather warning saves a driver from delays, document that success. Conversely, record the reasons behind missed predictions to prevent future errors.
Consider A/B testing for route recommendations. Apply predictive analytics to some routes while sticking with traditional methods for others. Compare the two approaches over the same period, accounting for variables like seasonal demand. This controlled method provides clear evidence of the system’s effectiveness.
Set up automated alerts for predictions that consistently deviate from actual outcomes by more than 10%. These alerts prompt immediate investigation, preventing small inaccuracies from escalating into bigger issues. Real-time dashboards can also flag anomalies quickly, enabling proactive responses.
Lastly, account for seasonal adjustments. Traffic during school holidays differs from term time, and December delivery volumes are vastly different from February. Retrain models quarterly to consider these seasonal variations and maintain accuracy year-round.
When major changes occur - such as adding new vehicle types, expanding service areas, or adjusting staffing levels - update your models immediately. If left unaddressed, outdated models can erode the efficiency gains you’ve worked hard to achieve.
The ultimate goal is to create a continuous improvement cycle: measure performance, identify gaps, refine models, and measure again. This iterative process ensures predictive analytics stays relevant and continues delivering benefits over the long term. Fleet managers committed to this approach can sustain efficiency gains, while those who neglect it risk seeing their improvements fade over time.
Overcoming Challenges in Adopting Predictive Analytics
Bringing predictive analytics into route planning isn't always smooth sailing. Fleet managers often face hurdles like messy data, sceptical drivers, and concerns over upfront costs. Tackling these challenges head-on with practical solutions can make the difference between a successful rollout and a frustrating false start. Sorting out data issues is a critical first step, paving the way to address team acceptance and budgeting concerns.
Resolving Data Quality and Integration Issues
One of the biggest barriers to adopting predictive analytics is poor data quality. Incomplete or inconsistent information can derail implementation before it even begins.
Start by auditing your data to pinpoint gaps - missing information on past routes, traffic patterns, or delivery times can all impact results. Standardising how data is collected ensures better quality right from the start.
For issues like incorrect sensor data, validation rules can help. For example, cross-referencing fuel sensor readings with GPS data can flag discrepancies, such as fuel consumption that doesn’t match the distance travelled. Fixing these errors early keeps your predictive models accurate.
Integrating data from multiple sources - like warehouse systems, driver logs, and third-party traffic updates - adds another layer of complexity. A centralised data warehouse with automated cleaning processes can make this easier. Tools like intelligent geocoding can also fill in missing details, such as incomplete addresses, using historical data.
Instead of going all-in from day one, start small with a pilot programme. This allows you to address data issues on a smaller scale before rolling out across your entire operation. If you’re using older fleet management systems that don’t easily sync with modern analytics tools, consider a phased approach. Map out all your data sources, use middleware or API connectors to bridge gaps, and run both old and new systems in parallel during the transition. Establish clear data ownership rules and update procedures to ensure consistency. Many companies find that bringing in a dedicated data integration specialist for the first few months speeds up the process and minimises disruptions.
Gaining Driver and Team Buy-In
Once the data side is under control, the next challenge is getting your team on board. Drivers may worry about job security, losing autonomy, or simply not trusting automated systems. If they feel the technology is being forced on them, adoption can stall.
Open communication is key. Explain that predictive analytics isn’t about replacing drivers but about making their jobs easier - optimising routes to reduce fatigue and improve safety. Involve experienced drivers early in the process, especially during pilot testing. Their feedback can uncover practical issues that data alone might miss, like tricky parking spots or narrow roads. When drivers see their input shaping the system, trust grows.
Show them the benefits that matter most. Predictive analytics can cut fuel costs, reduce idle time, and create more predictable schedules - leading to better work–life balance. For instance, one logistics company saw a 75% reduction in planning time and a 12% increase in daily delivery capacity after adopting AI-powered route optimisation. Training drivers to understand route recommendations - and emphasising that these are flexible suggestions, not rigid rules - can also help ease concerns. Starting with a small group of early adopters can create internal advocates who encourage others to embrace the system.
Managing Initial Costs and ROI Expectations
The financial side of implementation can be daunting, especially for smaller operators. Costs for predictive analytics can range from £15,000 to £100,000 or more, depending on your fleet size. These expenses typically include software licences, telematics devices, staff training, and system integration.
To justify the investment, focus on the measurable benefits. Predictive analytics often leads to significant savings - fuel costs can drop by 10–15%, and labour costs by 5–10% through reduced driver hours and overtime. For example, SIG Distribution reported a 25% increase in delivery capacity, lower fuel expenses, and a 15% improvement in on-time-in-full (OTIF) deliveries after adopting AI-driven routing.
Better on-time delivery also strengthens customer retention and reduces penalty fees. Many businesses see double-digit mileage reductions after implementing AI route optimisation, which translates into more reliable delivery windows. C.H. Robinson’s clients, for instance, achieved an average 15% cut in logistics costs through predictive analytics.
Optimised routing doesn’t just save money - it also extends vehicle lifespan by reducing unnecessary mileage. Maintenance costs can drop by 10–15%, thanks to less wear and tear. Predictive maintenance, powered by fleet telematics, can identify potential issues early, avoiding costly breakdowns.
Build a solid ROI model to present to stakeholders. Highlight typical payback periods - usually 12 to 24 months - and offer three-year financial projections. Use conservative estimates to manage expectations. Once you start seeing improvements in metrics like fuel efficiency, reduced planning time, and faster deliveries, concerns about upfront costs often fade.
For those on tighter budgets, look for telematics providers with affordable options. Companies like GRS Fleet Telematics offer tracking devices starting at £35 and monthly service fees from £7.99 per vehicle, making the technology accessible even for smaller fleets. All-inclusive pricing can simplify budgeting and avoid hidden costs. Bundled services with free installation can further reduce expenses. Use fleet analytics to monitor key metrics like fuel usage, maintenance schedules, and operational performance. Highlighting additional benefits, such as improved vehicle recovery rates and enhanced security, can also help demonstrate the value of your investment.
Conclusion
Predictive analytics is reshaping the way route planning is done in the UK, turning live and historical data into dynamic, efficient routing strategies. Gone are the days of manual, reactive planning - this technology uses traffic updates, weather forecasts, vehicle telemetry, and historical trends to create real-time solutions that save time, reduce costs, and enhance fleet management.
The results speak for themselves. Businesses have reported major gains in efficiency and cost savings. For example, SIG Distribution achieved a 25% increase in delivery capacity, reduced fuel expenses, and improved their on-time-in-full (OTIF) deliveries by 15% after implementing AI-driven routing systems. Another operator cut planning time by 75% while increasing daily delivery capacity by 12%. These improvements directly contribute to better profitability and operational performance.
But the benefits don’t stop at immediate savings. Predictive analytics offers businesses strategic insights into freight volumes, route efficiency, and capacity use. This allows operators to anticipate busy periods and adjust their resources accordingly. It also prepares them for potential disruptions, such as adverse weather, traffic jams, or supplier delays, by enabling proactive scenario planning rather than last-minute reactions. As customer demands for reliable deliveries grow - especially in sectors like e-commerce and retail - these tools become critical for staying ahead in a competitive market. They also complement the advanced tracking solutions discussed earlier.
GRS Fleet Telematics plays a key role in supporting predictive analytics by providing real-time van tracking data. Their dual-tracker system offers precise information on vehicle location, speed, fuel usage, and health, which is essential for accurate predictions. With affordable pricing and high recovery rates, GRS Fleet Telematics helps UK operators maintain full fleet visibility while keeping costs under control. Combining this live data with historical records allows for dynamic route optimisation tailored to actual conditions and vehicle performance.
FAQs
How does predictive analytics use data to make routes more efficient?
Predictive analytics uses a mix of real-time and historical data to make route planning more efficient and improve overall fleet performance. By examining factors like traffic patterns, weather conditions, and vehicle performance, it pinpoints the best routes to cut down on delays and save fuel.
This approach doesn’t just boost on-time performance - it also helps lower operating costs, offering businesses a smart way to streamline their fleet operations.
What are the upfront costs and potential return on investment of using predictive analytics for fleet management?
Implementing predictive analytics for fleet management doesn’t have to break the bank. The costs can vary based on the tools and technologies you select, but GRS Fleet Telematics offers a budget-friendly option. Their van tracking solutions start at only £7.99 per month, making it an accessible choice for businesses aiming to streamline routes and boost efficiency.
The potential for savings is substantial. Better route planning, fewer delays, and improved fleet performance can lead to reduced fuel consumption, lower maintenance costs, and significant time savings. Over time, these improvements translate into noticeable cost reductions and smoother operations.
How can fleet managers encourage drivers and teams to adopt predictive analytics for route planning?
Fleet managers looking to integrate predictive analytics into route planning should prioritise clear communication, proper training, and showcasing real-world benefits. Start by explaining how these tools can help cut down delays, boost efficiency, and make daily tasks easier for drivers. Use specific examples, like optimised routes that save time or lower fuel expenses, to illustrate the advantages.
Hands-on training is crucial to ensure drivers and teams feel confident using the new technology. Address any concerns by emphasising that these tools are designed to support their work, not replace it. To build trust and excitement, regularly share success stories and measurable results - such as shorter travel times or improved vehicle safety - that demonstrate how the technology is making a positive impact.