5 Key Metrics for Analysing Driver Behaviour
Monitor speeding, harsh braking, aggressive acceleration, idling and cornering to cut fuel, maintenance and insurance costs with telematics and coaching.
Every fleet manager wants safer drivers, lower costs, and fewer accidents. Analysing driver behaviour data helps achieve this by focusing on five key metrics:
- Speeding: Increases accident risk and wastes fuel. Addressing it can save up to £360 per vehicle annually.
- Harsh Braking: Leads to higher maintenance costs and accidents. Monitoring it reduces wear and improves safety.
- Aggressive Acceleration: Wastes fuel and increases drivetrain wear. Smoother driving can cut energy use by up to 25%.
- Engine Idling: Burns fuel unnecessarily, costing fleets thousands annually. Reducing idling improves efficiency.
- Harsh Cornering: Strains tyres and suspension, raising maintenance costs and accident risks.
Tracking and improving these behaviours can cut fuel consumption, reduce maintenance costs, and lower insurance premiums. Using telematics systems with real-time alerts, driver scorecards, and coaching tools makes this process easier and more effective.
1. Speeding Incidents
Definition and Measurement Methodology
Speeding incidents happen when drivers exceed legal speed limits or drive too fast for the conditions. Telematics systems track speed in real-time using GPS or vehicle diagnostics data. Another approach, known as relative speeding, compares a driver's speed to the road's average. This is especially important on rural roads, where even slight speeding can have severe consequences. These precise tracking methods form the backbone of the operational insights discussed below.
Impact on Fleet Performance
Speeding doesn’t just raise the risk of accidents - fleet drivers face a 30–40% higher incident risk compared to private motorists. It also affects fuel efficiency. Driving at optimal speeds can save up to 15% on fuel costs. By using telematics feedback, fleets can cut combined fuel and insurance costs by an average of £360 per vehicle each year.
Practical Applications for Fleet Management
Fleet managers can tackle speeding by implementing tools like driver league tables. These tables use colour-coded scoring systems (Green: above 80, Amber: 50–80, Red: below 50) to identify and address risky drivers. Daily briefings that map out speed violations and mobile app access to individual performance scores encourage drivers to improve quickly.
Quantifiable Outcomes
Regular speed tracking combined with daily coaching can enhance driving performance by approximately 20%. Vehicles equipped with in-cab coaching systems experience fewer harsh driving events - 4.2 per hour compared to 5.7 without coaching.
2. Harsh Braking Events
Definition and Measurement Methodology
Harsh braking happens when a driver applies more force than necessary to stop a vehicle, often identified through accelerometers that measure sudden g-force changes. Typically, systems flag harsh braking when a vehicle's speed decreases by more than 6.5 MPH per second. In research, deceleration rates exceeding 3 metres per second squared (m/s²) are often classified as harsh braking. To ensure fairness when comparing drivers across varying trip lengths, some systems use a "Braking Index." This index sums all braking incidents, applies severity weightings, and divides the total by driving hours. These detailed methods provide a consistent framework for analysing the effects of harsh braking on fleet operations.
Impact on Fleet Performance
The financial consequences of vehicle accidents can be staggering, with costs averaging around £74,000 per incident and reaching as high as £500,000 for fatal cases. Annually, employers face a collective burden of approximately £60 billion in legal fees, medical bills, and lost productivity due to vehicle accidents. Beyond these costs, frequent harsh braking can lead to mechanical issues, such as overheating and glazing of brake pads, which diminishes their efficiency. In battery electric vehicles, harsh braking bypasses the regenerative braking system, relying instead on friction brakes. This not only reduces energy recovery but also limits the vehicle’s range.
"Harsh braking is a common result of drivers not maintaining a safe following distance, increasing their risk of rear-end collisions." – MiX by Powerfleet
Practical Applications for Fleet Management
Fleet managers have tools at their disposal to address harsh braking. Driver scorecards, for example, can highlight risky braking patterns. Scores in the 0–40 range often indicate poor driving that may require immediate coaching to reduce insurance premiums and maintenance costs. Real-time alerts can notify drivers instantly when harsh braking occurs, promoting immediate behavioural adjustments. GPS data can also help determine whether a braking event was necessary for safety or a result of driver inattention. For drivers with high braking indices, regular inspections of brake pads and tyres are strongly recommended. Advanced telematics platforms, like those from GRS Fleet Telematics, allow fleet managers in the UK to monitor braking events in real time and schedule preventive maintenance.
Quantifiable Outcomes
Practical interventions have shown measurable results. For instance, at St Austell Brewery, daily driver briefings based on scorecards led to a 20% improvement in driving habits, with most drivers achieving scores in the 80–100 "Green" range. Similarly, eco-driving training delivered fuel savings of 8.6% in Belgrade’s public transport system and 13.6% for truck drivers in Kazakhstan.
3. Aggressive Acceleration
Definition and Measurement Methodology
Aggressive acceleration happens when a driver uses excessive power to increase speed, either from a standstill or a steady pace. Telematics systems track this behaviour with built-in accelerometers that measure g-force changes. A speed increase exceeding 8.5 MPH per second is flagged as aggressive. To ensure fair comparisons across varying trip lengths, fleet managers often calculate an Acceleration Index. This index adds up all acceleration incidents, applies severity weightings (e.g., a 6 MPH increase in one second might count as a "Level 3" event), and divides the total by the hours driven. For acceleration specifically, this index focuses on power usage, separate from braking metrics. Advanced systems, particularly in electric vehicles, also measure metrics like maximum accelerator pedal position (as a percentage of full throttle) and how quickly the pedal is pressed. These measurements are crucial for understanding how aggressive acceleration affects fleet performance.
Impact on Fleet Performance
Aggressive acceleration has a broad impact, from safety concerns to increased operating costs. It significantly raises fuel consumption and wastes energy. By adopting smoother driving habits, fleets can save up to 15% on fuel. For electric vehicles, eco-driving techniques - including moderate acceleration - can cut energy use by as much as 25%. Beyond fuel and energy, this behaviour accelerates tyre wear, raises maintenance expenses, and can lead to more vehicle downtime. Additionally, data shows that a 10-point improvement in acceleration scores corresponds to a 3.3% reduction in preventable accident risks.
Practical Applications for Fleet Management
Because of the safety and cost implications, addressing aggressive acceleration is essential. Real-time alerts can notify drivers immediately when harsh acceleration occurs, encouraging instant adjustments. Driver scoring systems with colour-coded ranges (e.g., Green: 81–100, Amber: 41–80, Red: 0–40) help identify who needs additional coaching. Daily feedback, focusing on specific incidents where points were lost, can make training more impactful. Driver League Tables and reward programmes for those showing improvement further motivate safer driving habits. However, factors like payload and weather conditions also influence the power needed for acceleration.
Quantifiable Outcomes
In electric truck fleets, only 8% of acceleration events reached full throttle, compared to over 25% among aggressive drivers. UK fleet managers, including those in rental and leasing companies, can use acceleration data to implement coaching programmes aimed at improving driver behaviour and reducing fuel or energy costs. Alongside metrics for speeding and harsh braking, acceleration is a key component of comprehensive fleet telematics analytics. GRS Fleet Telematics provides UK fleet managers with the tools they need to track and optimise acceleration patterns effectively.
4. Engine Idling Time
Definition and Measurement Methodology
Engine idling happens when a vehicle's engine is running while the vehicle itself is stationary, consuming fuel without moving an inch. To distinguish between brief stops - like waiting at traffic lights - and actual idling, modern telematics systems log a "stop" when the vehicle's speed stays below 1 km/h for more than 200 seconds. Advanced systems go a step further, detecting idling through the engine's "ON" status via the CAN bus, voltage changes, or lack of movement. Typically, idling before a trip is attributed to the previous journey, while idling at the end is counted towards the current trip.
Impact on Fleet Performance
Idling is a silent drain on resources. It burns fuel and contributes to engine wear, all without delivering any productive output. For example, a compact diesel car uses about 0.64 litres of fuel per hour while idling, while a petrol equivalent consumes around 0.61 litres. For heavy goods vehicles, the numbers are even starker - each minute of idling burns approximately 21.7g of diesel and releases 68.64g of CO₂.
In a fleet of 50 vans, just 30 minutes of idling per driver daily could lead to an additional 1,300 litres of diesel consumed each month, adding up to roughly £1,800 in fuel costs. Beyond the financial hit, idling accelerates engine wear. One minute of idling can equal the wear caused by driving two miles, as engines operate inefficiently at low speeds. This inefficiency can lead to carbon build-up, shorten engine life, and increase maintenance costs. Reducing idling isn’t just about saving money - it also keeps vehicles in better condition for longer.
Practical Applications for Fleet Management
Fleet managers can tackle idling head-on by leveraging telematics tools. These systems allow managers to generate reports comparing idling time to total engine hours, making it easier to spot vehicles or drivers with excessive idle times. Real-time alerts can be set up to notify managers when idling exceeds a set limit, such as 20 or 30 minutes. Policies can also be introduced requiring drivers to switch off engines after just 1–2 minutes of idling. Telematics dashboards provide monthly data that highlight repeat offenders and identify locations where idling is most common, enabling targeted coaching to address these habits during breaks or loading activities.
Quantifiable Outcomes
Taking steps to reduce idling can yield impressive results. Anti-idling measures alone can cut fuel consumption by 1% to 5%, while eco-driving training has the potential to slash fuel use by up to 25% - a significant boost to profit margins. Even ten minutes of idling per driver each day can waste over £120 in fuel annually. Considering that fuel can account for as much as 60% of operating costs in road haulage, tackling idling is an easy win for profitability. GRS Fleet Telematics provides van tracking solutions for UK fleet managers to monitor and reduce idling, making it a practical solution for cutting costs and improving efficiency.
5. Harsh Cornering Incidents
Definition and Measurement Methodology
Alongside speeding, braking, and acceleration, harsh cornering is another key metric for understanding driver behaviour.
Harsh cornering happens when a vehicle takes a turn with too much force. Telematics systems flag this when lateral g-force exceeds 0.4g for at least two seconds. For context, a reading of 0.5g signals aggressive cornering, while 1g can even cause tyres to squeal.
The acceptable g-force threshold depends on the vehicle type. Passenger cars can typically handle higher levels, but for heavy-duty vehicles, stricter limits are critical to avoid tipping or shifting cargo. For fleets carrying fragile goods, managers may need to adjust these thresholds accordingly.
Impact on Fleet Performance
Harsh cornering doesn't just affect driving safety - it also puts unnecessary strain on vehicles. It accelerates tyre wear, damages suspension systems, and increases the likelihood of rollovers or jackknifing in larger vehicles. Additionally, aggressive cornering can reduce fuel efficiency by 15% to 30% at motorway speeds.
The financial risks are considerable as well. When a fleet driver is involved in an accident, the average starting cost is £57,000. If the accident results in a fatality, this figure can soar to £385,000.
Practical Applications for Fleet Management
Fleet management systems use colour-coded scores to make harsh cornering data actionable. Drivers receive ratings - Green (81–100), Amber (41–80), or Red (0–40) - to indicate performance and identify those needing improvement. Real-time alerts can prompt immediate corrections.
For coaching purposes, managers can review event-triggered video footage from AI-enabled dashcams, providing visual evidence to reinforce feedback.
Quantifiable Outcomes
Addressing harsh cornering habits can yield tangible benefits. Fleets can see up to a 15% reduction in fuel costs and lower accident risks. Driver league tables encourage healthy competition, while mobile access to performance data drives consistent improvement.
With tools like GRS Fleet Telematics, UK fleet managers can monitor cornering patterns, identify high-risk drivers, and implement coaching strategies that safeguard both employees and company profits.
How to organize and track your fleet's Driver Behavior Data | Understanding Fleet Data
Comparison Table
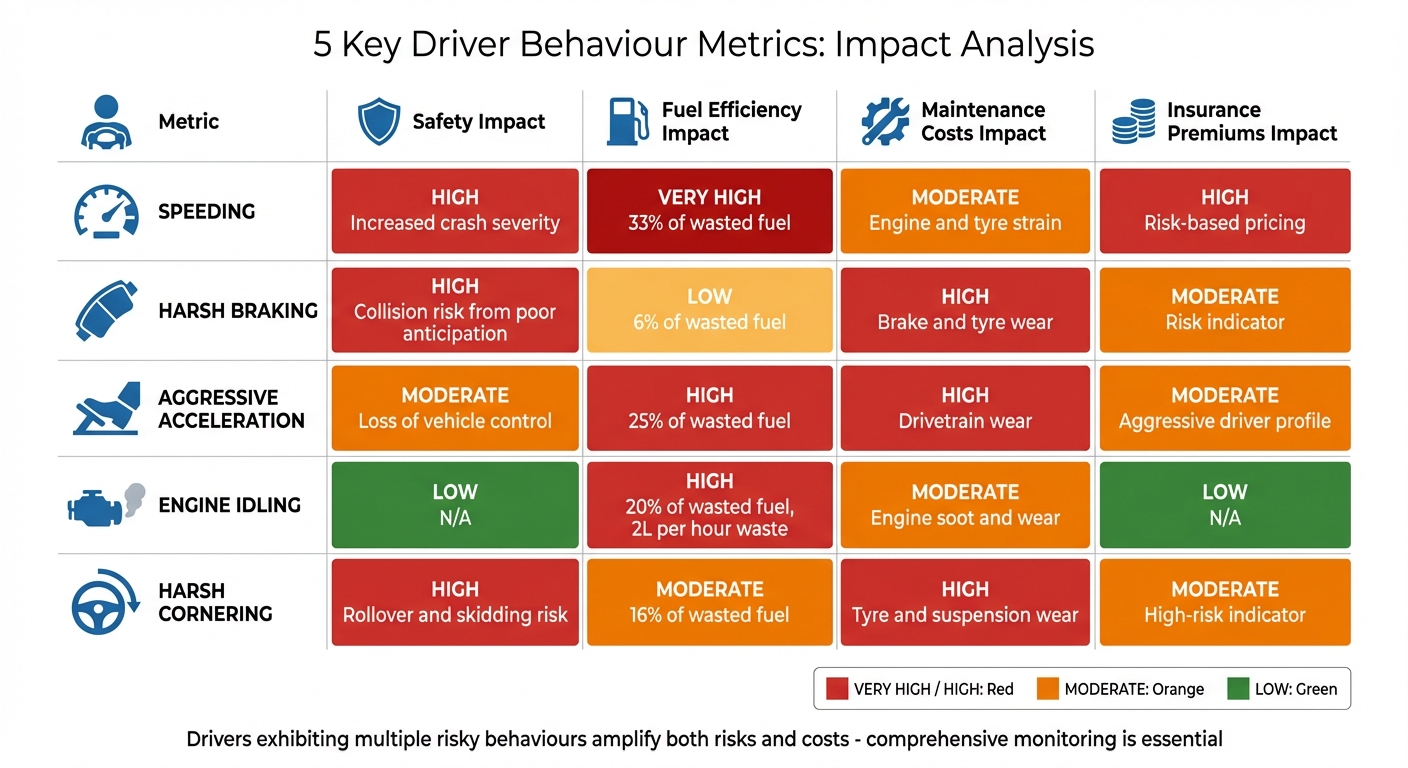
5 Driver Behaviour Metrics Impact on Fleet Performance Comparison
Understanding how driver behaviour impacts fleet performance is crucial. The table below breaks down how various metrics affect safety, fuel efficiency, maintenance, and insurance costs.
| Metric | Safety Impact | Fuel Efficiency Impact | Maintenance Costs Impact | Insurance Premiums Impact |
|---|---|---|---|---|
| Speeding | High (Increased crash severity) | Very High (33% of wasted fuel) | Moderate (Engine and tyre strain) | High (Risk-based pricing) |
| Harsh Braking | High (Collision risk from poor anticipation) | Low (6% of wasted fuel) | High (Brake and tyre wear) | Moderate (Risk indicator) |
| Aggressive Acceleration | Moderate (Loss of vehicle control) | High (25% of wasted fuel) | High (Drivetrain wear) | Moderate (Aggressive driver profile) |
| Engine Idling | Low (N/A) | High (20% of wasted fuel, 2L per hour waste) | Moderate (Engine soot and wear) | Low (N/A) |
| Harsh Cornering | High (Rollover and skidding risk) | Moderate (16% of wasted fuel) | High (Tyre and suspension wear) | Moderate (High-risk indicator) |
These metrics highlight the direct link between driver behaviour and operational costs. For instance, speeding stands out as the most damaging behaviour, leading to increased crash severity, significant fuel waste, and higher insurance premiums. Similarly, harsh braking and harsh cornering pose serious safety concerns, with additional maintenance costs tied to brake, tyre, and suspension wear.
From a financial perspective, engine idling and aggressive acceleration are major contributors to fuel inefficiency. Although these behaviours might not immediately affect insurance premiums, their cumulative impact on fuel and maintenance expenses can be substantial.
Drivers who exhibit multiple risky behaviours, such as combining speeding with harsh cornering, amplify both risks and costs. This makes comprehensive monitoring essential for effective fleet management. By tracking all five metrics, fleet managers can develop targeted strategies to improve safety, reduce expenses, and make smarter operational decisions.
Conclusion
Tracking five key driver behaviour metrics - speeding, harsh braking, aggressive acceleration, engine idling, and harsh cornering - can improve safety, cut costs, and optimise operations. Each metric highlights specific risks and opportunities, from reducing accident rates to saving fuel and extending vehicle longevity. Together, they offer a comprehensive view of driver performance and pinpoint areas for improvement.
These insights translate into tangible financial gains. For instance, companies using telematics can lower fuel consumption by up to 15% by encouraging better driving habits. This not only reduces fuel costs but also trims down maintenance and insurance expenses. Beyond the numbers, addressing these behaviours fosters a safer environment for both drivers and other road users.
GRS Fleet Telematics equips fleet managers with the tools to monitor and respond to these metrics effectively. The platform features real-time tracking, instant alerts, and detailed driver scorecards, allowing managers to identify and address risky behaviours as they occur. Automated data on fuel use, speed violations, and harsh driving events removes the uncertainty of manual tracking, offering precise and actionable insights.
With subscriptions starting at just £7.99 per vehicle per month, the package includes SIM data, platform access, and a dedicated account manager. Hardware options range from the Essential tracker at £35 to the Ultimate package at £99, which includes immobilisation features. Fleets opting for GRS Fleet Telematics branding can also benefit from free installation.
When addressing driver behaviour, it's best to focus on two metrics at a time - such as speeding and harsh braking - for a more manageable and effective approach. This targeted strategy ensures drivers can prioritise key areas, making coaching sessions more impactful and driving measurable improvements across your fleet.
FAQs
Which two driver metrics should I improve first?
The two key metrics to focus on are speeding and harsh braking. These driving behaviours are directly linked to safety and cost management, making them essential for boosting overall performance. Tackling these issues first can play a major role in lowering risks and improving fleet efficiency.
What thresholds define harsh braking, acceleration, and cornering?
Thresholds for harsh braking, acceleration, and cornering are determined by g-force levels that surpass predefined settings in fleet management systems. For example, extreme events involving deceleration or acceleration between 3-6g are comparable to what you might experience during Formula One braking or the intense forces of a rollercoaster. These settings can be adjusted to align with the specific needs of a fleet.
How do I separate necessary braking from risky driving?
To tell the difference between necessary braking and risky driving, it’s important to look at braking events in the context of other behaviours and situations. For instance, harsh braking to avoid a hazard is a responsible action. But frequent, aggressive braking without a clear reason could point to unsafe driving habits.
Telematics data plays a key role here. It provides insights into the magnitude, duration, and context of braking events. This allows fleet managers to spot patterns and offer focused coaching to drivers, helping them address any unsafe practices effectively.