How Cloud Analytics Improves Fleet Efficiency
Cloud analytics transforms fleet operations, cutting fuel and maintenance costs while optimising routes and driver behaviour.
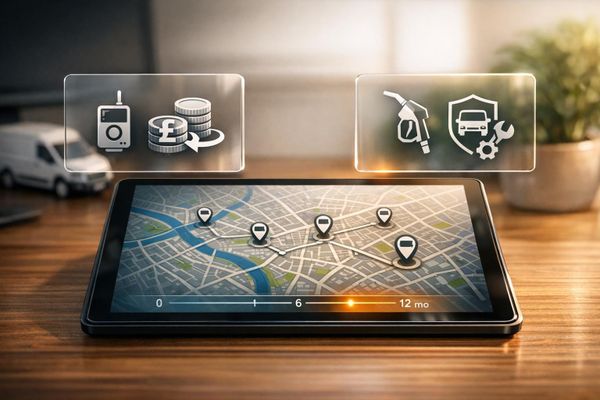
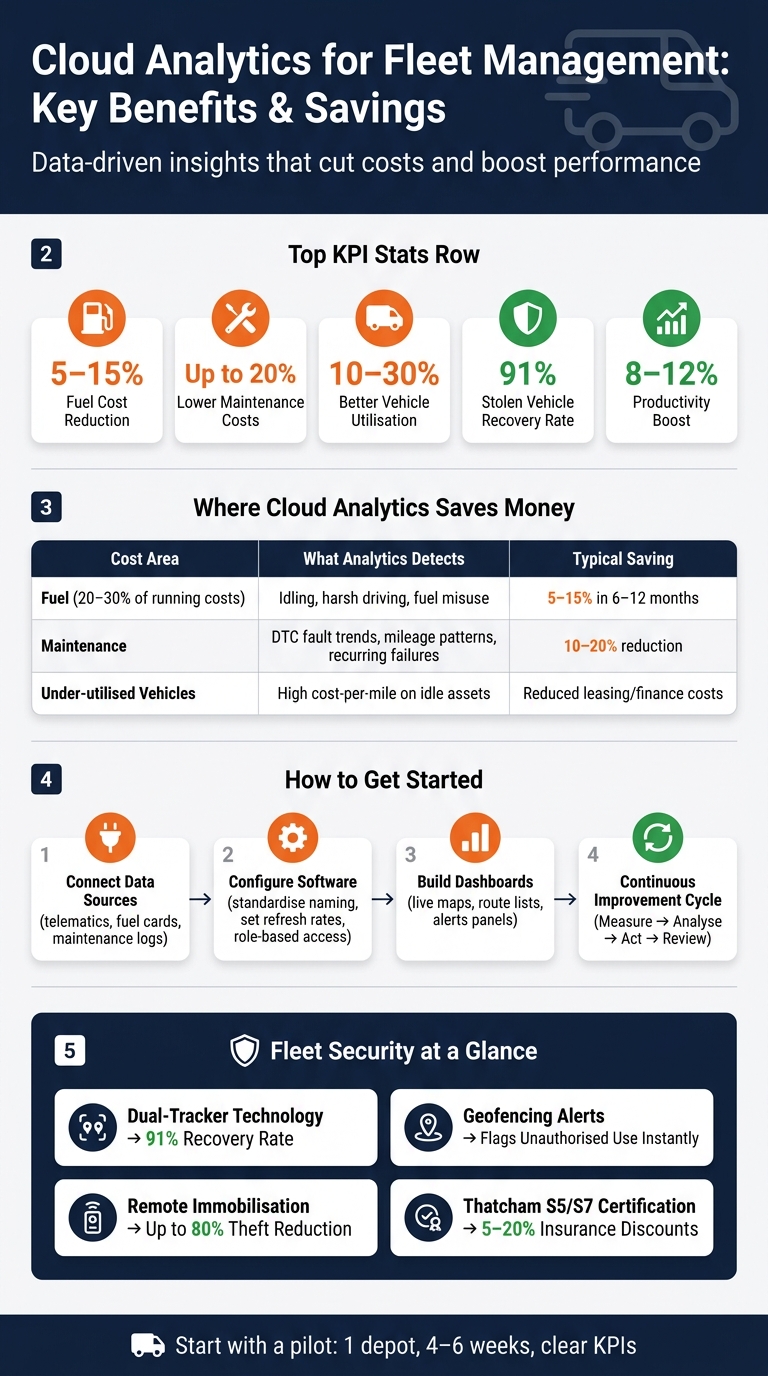
Cloud analytics helps fleet managers cut costs, improve performance, and keep vehicles in top shape. It collects and analyses data from vehicle sensors, GPS, and other systems in real time, providing actionable insights. This means better fuel efficiency, smarter routes, reduced downtime, and improved driver behaviour.
Key takeaways:
- Fuel savings: Monitor usage and reduce idling for 5–15% lower costs.
- Predictive maintenance: Prevent breakdowns and cut repair expenses by up to 20%.
- Route optimisation: Plan smarter routes to save time and fuel.
- Driver performance: Use data to improve safety and reduce wear and tear.
- Fleet security: Tools like dual trackers and geofencing reduce theft risks.
With cloud analytics, you can track metrics like cost per mile, vehicle utilisation, and on-time performance, all in one place. Start small - pilot a few vehicles or one depot - and scale improvements fleet-wide for long-term gains.
Cloud Analytics Fleet Efficiency: Key Savings & Benefits
How to Set Up Cloud Analytics for Your Fleet
Setting up cloud analytics for your fleet involves three key steps: integrating relevant data, standardising software configurations, and maintaining ongoing data accuracy. When done right, this can lead to major savings - cutting fuel costs by 10–15% and reducing maintenance expenses by up to 20%. However, a poorly executed setup can leave you with confusing dashboards and unreliable insights. Here's how to get it right.
Connecting Your Data Sources
Before diving into software configuration, it's crucial to clarify your goals. Are you aiming to cut fuel expenses? Reduce unplanned downtime? Your objectives will guide which data sources - fuel card transactions, telematics data, maintenance logs, and more - are essential. This approach helps you avoid collecting unnecessary data that adds complexity without value.
For UK van fleets, a good starting point typically includes:
- Vehicle trackers or telematics units
- Fuel card feeds
- Maintenance and service records
- Job or dispatch data from route-planning systems
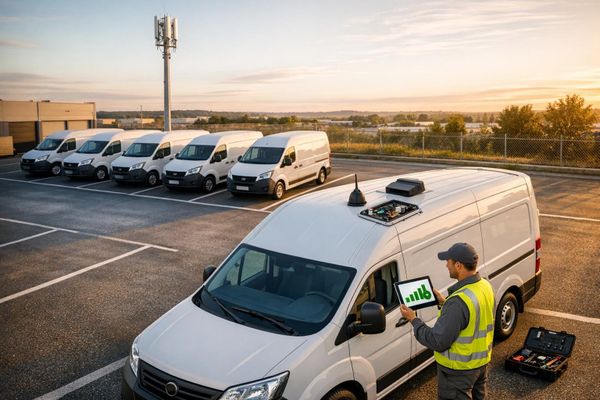
For instance, a fleet using GRS Fleet Telematics tracking devices can integrate real-time vehicle location and usage data into a cloud platform. Combined with fuel and maintenance records from other systems, this provides a comprehensive view of fleet operations.
Configuring Your Fleet Software
Once your data sources are identified, focus on standardising how data is labelled. Every system should use consistent identifiers for vehicles, drivers, and trips. A master asset register with uniform naming conventions helps avoid mismatches between tracker data, fuel records, and service logs.
Next, configure key settings to align with your operations. Consider these factors:
- Data refresh frequency: Live updates are crucial for delivery fleets, while periodic updates may suffice for other vehicles.
- Role-based access: Operations teams might need live dashboards, finance teams require cost data, and maintenance teams should receive fault alerts.
- Automated processes: Set up rules for overnight fuel card imports and mileage-triggered service reminders. This reduces manual input and allows managers to focus on exceptions rather than routine data entry.
Keeping Data Accurate and Compliant
The quality of your analytics depends on maintaining accurate data. Regularly validate GPS readings, odometer entries, fuel usage, and service dates against source records. Look out for anomalies like impossible trip distances, duplicate fuel entries, or inconsistent location reports to ensure data integrity.
For UK fleets, compliance with GDPR is another critical aspect. If your analytics include location history, driver behaviour scoring, or identification, you need a lawful basis for data collection. Clear communication with staff, strict access controls, and robust data protection measures are essential. Ensure any third-party cloud provider meets data security standards and includes contractual safeguards. The rule of thumb? Only collect what you need, protect it thoroughly, and document its use.
sbb-itb-499a7f0
Route Optimisation and Vehicle Utilisation
Improving how routes are planned and vehicles are used is central to meeting efficiency targets. Once your data sources are linked and your software is set up, the next step is to make that data work for you - focusing on the movement of your fleet and how effectively it handles daily tasks.
Building Real-Time Route Dashboards
After connecting your data and configuring your software, the next logical step is creating real-time dashboards to monitor fleet operations. These dashboards provide a consolidated view of each vehicle's location, schedule adherence, and stop durations. The most effective setups combine a live map, a route and stop list, and an alerts panel into a single interface.
On the live map, vehicles are marked with their current position and status, often colour-coded to indicate whether they are on time, at risk, or delayed. Alongside this, the route list compares planned and actual arrival times as well as stop durations. For instance, if a driver spends 25 minutes at a stop that typically takes 10 minutes, this discrepancy becomes immediately visible.
For UK operators, displaying times in a 24-hour format (e.g., 14:35) and distances in miles ensures the system aligns with local standards. Tools like GRS Fleet Telematics integrate real-time tracking with cloud-based analytics, offering a streamlined way to view these metrics in a single, user-friendly dashboard.
Using Data to Plan Better Routes
The information captured in real-time dashboards also helps refine route planning. By analysing trips based on time of day and day of the week, managers can understand actual route performance beyond theoretical estimates. This allows for adjustments like tweaking start times or resequencing stops to avoid predictable delays.
Many cloud platforms can simulate alternative scenarios. For example, starting early routes at 06:00 might reduce total travel time and mileage without disrupting the broader operation. A measured approach works best: track baseline performance over four to six weeks, test changes on a small scale - such as a single depot or a handful of routes - and then compare results. Metrics like total miles driven, on-time performance, and overtime hours can guide decisions before rolling out changes across the entire fleet.
Getting More from Your Fleet
Cloud analytics can significantly improve vehicle utilisation, yet this opportunity is often overlooked. By tracking daily mileage, hours of use, and tasks completed per vehicle, fleet managers can quickly identify underused assets. Visual tools like calendar heat maps can highlight vehicles that remain idle for long periods or are only active on specific days. These insights make it easier to consolidate underloaded routes, adjust territory boundaries between depots, or assign weekend and overnight jobs to vehicles that are currently underutilised. The result? Reduced unnecessary mileage and enhanced productivity.
Monitoring utilisation over several months also reveals seasonal trends, enabling smarter decisions, such as choosing short-term hires over permanent fleet expansions. These insights can lead to significant operational cost savings while maintaining efficiency.
Cutting Operational Costs with Cloud Analytics
Cloud analytics is transforming how fleets manage their operational costs, going beyond route planning and vehicle utilisation. By providing a clear view of fleet performance, it allows companies to tackle major expenses like fuel, maintenance, and tyres in a measurable way. For UK fleets, these three areas often represent the bulk of variable operating costs.
Tracking Fuel Use and Reducing Idling
Fuel accounts for 20–30% of total fleet running costs for commercial operators, making it the top area where analytics can deliver savings quickly. Integrating telematics with fuel card data enables fleets to identify unusual refuelling events by cross-referencing GPS and tank capacity data. This can help address fuel misuse, which may account for 2–5% of total fuel expenses in poorly monitored fleets.
Idling is another area where savings can be achieved with minimal effort. Setting your platform to flag idling events - for instance, over 3–5 minutes on urban routes or 10–15 minutes on motorways - is a practical first step. Detailed reports showing total idle time, fuel consumption during idling, and idle percentages by driver, vehicle, and depot make it easier to address the issue. Presenting these figures in terms of litres and pounds per week adds impact during driver briefings. Solutions like GRS Fleet Telematics offer dual-tracker technology that captures precise engine-on/engine-off data, enhancing idling analysis.
Fleets that actively monitor and manage fuel consumption through telematics often see savings of 5–15% within six to twelve months, especially if no prior monitoring was in place. Once fuel efficiency is under control, attention can shift to preventing costly breakdowns through better maintenance.
Predictive Maintenance Scheduling
Traditional maintenance schedules are based on fixed intervals, regardless of how vehicles are used. Predictive maintenance, however, uses fault codes (DTCs), mileage, engine hours, and usage patterns to identify potential issues before they escalate into breakdowns.
For example, repeated DPF-related fault codes like P2463 on Euro 6 diesel vans used for short urban trips can indicate soot build-up, signalling the need for a forced regeneration or workshop visit before the vehicle enters a derated state. Similarly, recurring ABS or ESP warnings at similar mileages across a specific vehicle model could prompt pre-emptive sensor inspections fleet-wide. Monitoring battery voltage alongside vehicle age can also help predict failures ahead of winter, allowing for planned replacements rather than emergency fixes.
Adopting condition-based maintenance can reduce unplanned breakdowns by 30–50% and lower overall maintenance costs by 10–20%. Planned repairs are generally more economical, as parts can be ordered in advance, and servicing can be scheduled at convenient times.
Cost Monitoring and Benchmarking
In addition to optimising routes and managing fuel, tracking overall costs per mile provides a unified view of all efficiency improvements. Cost per mile is a key performance metric that combines fuel, maintenance, tyres, and other running costs into one figure. It allows comparisons across vehicle types, routes, and depots. For example, if one depot consistently has a higher cost per mile than others with similar vehicles and routes, it signals an opportunity for deeper investigation - whether it’s due to driving habits, vehicle condition, or route inefficiencies.
| Cost Category | What Analytics Reveals | Typical Saving Potential |
|---|---|---|
| Fuel | Idling, harsh driving, and misuse matched to GPS data | 5–15% reduction in 6–12 months |
| Maintenance | DTC trends, mileage patterns, recurring failures | 10–20% reduction in maintenance spend |
| Under-utilised vehicles | High cost per mile on under-used assets | Reduced leasing/finance on redundant vehicles |
Reviewing monthly cost-per-mile figures by depot and setting specific targets - such as a 5% improvement in fleet mpg over a quarter - can help track progress. Vehicles that consistently have the highest costs per mile, even after accounting for route type, may be candidates for replacement or redeployment. Sharing the best practices of high-performing depots across the fleet can lead to quick and meaningful savings.
Driver Performance and Fleet Security
Improving driver performance and enhancing fleet security are key to boosting efficiency, safety, and cutting operational costs. With cloud analytics, fleet managers can gain an unbiased, data-driven view of driving standards across their operations, moving beyond anecdotal evidence.
Monitoring Driver Behaviour
Telematics data provides real-time insights into actions like speeding, harsh braking, and rapid acceleration. This allows managers to spot risky behaviour before it leads to accidents or costly claims. By setting thresholds for alerts, deviations can be flagged immediately, ensuring swift intervention.
One powerful tool in this process is driver scorecards. These scorecards compile multiple metrics into a single performance score, enabling managers to compare individual drivers against the fleet average. This system not only creates transparency but also encourages drivers to improve their scores through healthy competition, fostering a culture of accountability and excellence.
Using Analytics to Support Driver Training
Generic training often falls short of addressing specific issues. Instead, using actual incident data to guide coaching can make a real difference. For instance, if a driver frequently triggers alerts for harsh braking on a particular route, training can zero in on that specific behaviour. With cloud analytics, managers can group incident trends by driver, vehicle, or route to deliver targeted feedback that addresses real risks.
Tracking progress is equally crucial. Establishing a baseline score for each driver and reviewing it monthly gives both managers and drivers clear goals. Fleets adopting this data-focused approach often see measurable safety improvements within three to six months. These changes in behaviour also help strengthen overall fleet security.
Improving Fleet Security
Better driving habits go hand-in-hand with advanced security measures to protect both drivers and vehicles. Vehicle theft remains a major issue for UK fleet operators, but cloud analytics offers practical solutions. Features like real-time tracking, geofencing alerts, and remote immobilisation significantly reduce theft risks and streamline recovery efforts.
For example, GRS Fleet Telematics offers a dual-tracker setup, combining a primary wired tracker with a Bluetooth backup. This system achieves an impressive 91% vehicle recovery rate. Their Ultimate package (£119 hardware) includes remote immobilisation, enabling managers to disable a vehicle’s engine if moved without permission. Additionally, vehicles with Thatcham S5/S7 certification may qualify for insurance discounts of 5–20%, which can lead to considerable savings for larger fleets.
| Security Feature | Benefit | Impact |
|---|---|---|
| Dual-Tracker | Wired tracker + Bluetooth backup | 91% recovery rate |
| Geofencing | Virtual boundaries with instant alerts | Flags theft and unauthorised use |
| Remote Immobilisation | Engine disablement capability | Up to 80% reduction in theft |
| Thatcham S5/S7 | Insurance certification | 5–20% premium discounts |
| Driver ID Fobs | Individual accountability | Precise journey and time logging |
Driver ID fobs deserve special mention, as they link every trip to a specific driver. This not only enhances accountability but also simplifies investigations into security incidents or disputes over vehicle use.
Building a Continuous Improvement Cycle
Integrating cloud analytics into daily fleet management can create a feedback loop for continuous improvement. By cycling through steps like setting targets, measuring outcomes, testing changes, and reviewing results, you can turn telematics data into a practical tool for ongoing operational gains. This process aligns closely with the Plan–Do–Check–Act (PDCA) model, building on earlier efforts such as data integration and route optimisation to ensure lasting improvements.
Setting KPIs and Baselines
To improve operations, you first need a clear understanding of how you're performing today. Start by selecting a few key performance indicators (KPIs) that align with your goals. For instance, if cutting costs is your focus, track metrics like fuel consumption per mile, idle time per engine hour, and maintenance costs per vehicle. If service quality takes priority, monitor on-time delivery rates and the percentage of failed deliveries. Be careful not to track too many KPIs at once, as this can overwhelm decision-making.
Once you've chosen your KPIs, collect three to six months of historical telematics data to establish a baseline. This period accounts for seasonal factors common in UK operations, such as winter weather affecting journey times or increased delivery volumes during Christmas. Baseline data provides a reference point for measuring progress and builds on earlier insights into cost and efficiency. Segmenting these baselines by depot, vehicle type, or driver can help pinpoint where the largest gaps exist, allowing you to focus on areas with the most potential for improvement.
Testing Changes and Measuring Results
Instead of implementing changes fleet-wide right away, start with a controlled pilot. Select a small group of vehicles or one depot, clearly define the change - whether it’s a new routing rule, adjusted delivery windows, or a driver coaching programme - and agree on what "success" looks like. For example, you might set a goal of reducing fuel consumption by 5% over four weeks. Use your cloud dashboard to compare the pilot group's performance against your baseline.
Combine analytics data with driver feedback to evaluate the results. While the data can show whether fuel use has dropped or delivery times have improved, feedback can reveal why certain changes worked - or why they didn’t - before rolling them out more widely. This method builds on earlier continuous monitoring efforts, ensuring each adjustment contributes to long-term efficiency.
Scaling What Works Across Your Fleet
Once a pilot programme delivers consistent improvements without causing issues like increased overtime or customer complaints, it’s time to scale the changes fleet-wide. Document the process, update your procedures, and train staff to ensure smooth implementation. Cloud dashboards simplify this process, offering tools to monitor real-time performance and quickly identify any setbacks. For example, GRS Fleet Telematics provides user-friendly dashboards that help UK fleet managers oversee operations and maintain progress.
Research shows that actively using telematics analytics can lead to productivity boosts of 8–12% and fuel consumption reductions of 15–20% over time. However, these gains are only sustainable if improvements are embedded into daily workflows and reviewed regularly - ideally on a monthly or quarterly basis.
Conclusion: Using Cloud Analytics to Run a More Efficient Fleet
Cloud analytics gives fleet operators in the UK a clear, data-driven perspective on the daily performance of vehicles, drivers, and routes. Instead of waiting to address issues after they arise, it allows you to identify patterns early - whether it's a vehicle idling excessively in traffic, a route that regularly results in late deliveries, or a driver whose harsh braking increases wear and tear.
Fleets adopting cloud analytics often report impressive results: fuel cost savings of 10–15%, maintenance cost reductions of up to 20%, and improved vehicle utilisation rates of 10–30%. These insights feed directly into regular operational reviews, enabling proactive management and continuous improvement.
The key to success lies in following a structured cycle: measure → analyse → act → review. Cloud platforms simplify this process by automatically storing historical data, making it easy to compare year-on-year performance or conduct seasonal analysis.
To get started, begin with a small-scale pilot. Choose one depot or a few vehicles, set clear KPIs, and run a four-to-six-week trial. This approach minimises disruption and provides tangible results to share with drivers and management. By applying this cycle consistently, you can embed data-driven practices across your entire fleet operation.
GRS Fleet Telematics offers tools to help businesses across various industries implement cloud analytics from the outset. Their van tracking solutions deliver real-time data on vehicles and drivers, powering analytics dashboards. With dual-tracker technology and an impressive 91% stolen-vehicle recovery rate, they also enhance security beyond what basic tracking systems provide. Subscriptions start at just £7.99 per vehicle per month, backed by 35 years of industry expertise. Take the step towards proactive, data-led fleet management with cloud analytics.
FAQs
What data do I need to start cloud analytics for my fleet?
To get started with cloud analytics for your fleet, the first step is installing telematics devices, such as those offered by GRS Fleet Telematics. These devices gather essential data, including GPS location, engine diagnostics, and driver behaviour (like harsh braking). Pair this information with external data sources - traffic patterns, weather conditions, and schedules - to generate predictive insights. It's important to ensure these devices are compatible with your fleet management software to keep data integration smooth and uninterrupted.
How quickly can cloud analytics cut fuel and maintenance costs?
Cloud analytics and telematics offer tangible savings in a short timeframe, with many fleets recouping their investment in under a year. By leveraging tools like real-time route optimisation and predictive maintenance, businesses can cut fuel costs by 10–30% and reduce maintenance expenses by 15–25%. GRS Fleet Telematics plays a key role in achieving these savings, allowing managers to move away from manual processes and make data-driven decisions that can save thousands of pounds each year.
How do I stay GDPR-compliant when tracking drivers and vehicles?
To ensure compliance with GDPR, focus on gathering only the data required for your operations. Protect this information by implementing AES-256 encryption for stored data and TLS 1.2 or higher for data in transit. Strengthen security further with multi-factor authentication and conduct annual security audits to identify and address vulnerabilities.
Be transparent with drivers about how their data is used, and set clear retention periods for the information you collect. Automate the deletion of data that is no longer necessary to align with GDPR guidelines and maintain trust.