Fleet Utilisation Metrics: Meaning and Formula
Explore essential fleet utilisation metrics, formulas, and strategies to optimise vehicle performance, reduce costs, and enhance sustainability.
Fleet utilisation metrics help businesses measure how effectively their vehicles are used. These metrics identify inefficiencies, reduce costs, and improve performance. Key formulas include:
-
Vehicle Utilisation Rate: (Active hours ÷ Available hours) × 100
Tracks how much time vehicles are in use. -
Fleet Capacity: (Total vehicles × Billable hours) ÷ Workdays
Measures workload handling ability. -
Cost per Mile/Job: Total costs ÷ Miles driven or Jobs completed
Analyses operational expenses. -
Fuel Efficiency: 282.48 ÷ L/100km = MPG
Calculates fuel consumption. -
Downtime Percentage: (Non-productive hours ÷ Available hours) × 100
Monitors vehicle downtime.
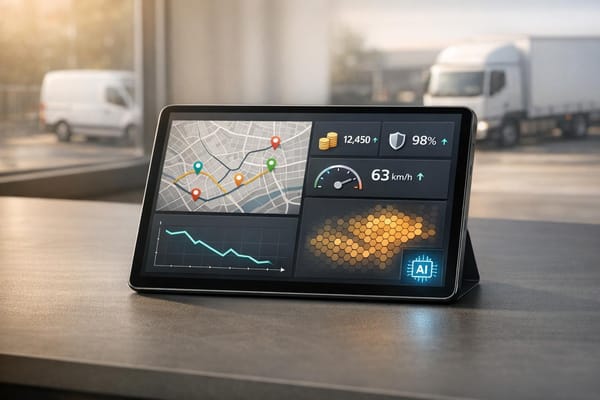
Telematics tools play a major role by providing real-time data for tracking and improving these metrics. Together, these insights inform better decisions, helping businesses optimise their fleets, save money, and meet customer demands effectively.
Most Fleets Are Tracking Utilization WRONG #fleetmanagement #fleetmanagementsoftware
Main Fleet Utilisation Metrics and Formulas
Getting a handle on the key metrics that measure fleet performance is essential for making smart decisions about vehicle operations. These metrics provide solid data to uncover inefficiencies, manage costs, and allocate resources effectively. Fleet utilisation metrics can track driver and vehicle performance based on factors like distance, time, cost, volume, weight, or size.
Building on earlier telematics insights, let’s explore some precise formulas that can help optimise fleet operations.
Vehicle Utilisation Rate
The Vehicle Utilisation Rate (VUR) shows how effectively your fleet is being used by comparing active hours to total available hours. It helps determine whether vehicles are being utilised efficiently or sitting idle.
Formula:
(Total active vehicle hours ÷ Total available hours) × 100
For example, if a van is available for 10 hours but used for only 7 hours, its utilisation rate is 70%. This metric helps fleet managers spot underused vehicles and better understand daily activity patterns. Keep in mind that benchmarks will differ depending on the type of operation - city-based delivery drivers face different challenges compared to long-haul drivers.
Fleet Capacity
Fleet capacity measures the maximum workload your fleet can handle within a specific timeframe. It’s a useful way to determine if you’re meeting demand or running with excess resources.
Formula:
(Total Trucks × Total Billable Hours Available) ÷ Days of the Work Week
For instance, a concrete pumping company might set a standard of six billable hours per pump, while other heavy machinery companies could aim for as high as 10. When calculating capacity, it’s crucial to factor in total available billing hours and account for seasonal fluctuations to set realistic benchmarks.
Cost per Mile/Job
This metric reveals how efficiently your fleet operates by comparing total running expenses to the work completed. It’s a valuable tool for budgeting and pricing.
Formula:
Total running costs ÷ Miles driven or Jobs completed
When calculating cost per mile, include expenses such as fuel, maintenance, insurance, driver wages, and vehicle depreciation. If calculating per job, divide total operational costs by the number of completed jobs or deliveries. Since fuel can account for 24% of total operational costs, this metric is particularly helpful in identifying areas to cut costs and improve pricing strategies. Regular tracking can highlight areas for savings.
Fuel Efficiency
In the UK, fuel efficiency is measured in several ways:
- Litres per 100 kilometres (L/100km) – Lower values show better efficiency.
- Kilometres per litre (km/L) – Higher values show better efficiency.
- Miles per gallon (MPG) (using imperial gallons) – Higher values show better efficiency.
Conversion guidelines:
- 1 imperial gallon = 4.546 litres
- To convert L/100km to MPG: 282.48 ÷ L/100km = MPG
- To convert MPG to L/100km: 282.48 ÷ MPG = L/100km
Fuel makes up about 22% of vehicle ownership costs, so monitoring efficiency is critical for managing expenses. Telematics systems track mileage, fuel consumption, and driver behaviour to uncover efficiency trends. For example, data may reveal issues like excessive idling, aggressive driving, or poor route planning that impact fuel usage.
This insight complements downtime analysis, offering a fuller picture of operational efficiency.
Downtime Percentage
Downtime percentage tracks how much time vehicles are out of service due to maintenance, repairs, or other non-productive activities.
Formula:
(Non-productive hours ÷ Total available hours) × 100
Non-productive hours might include scheduled maintenance, unexpected repairs, waiting for parts, or administrative delays. A high downtime percentage could point to problems with maintenance schedules, vehicle reliability, or operational workflows. For instance, nearly 50% of pickups and deliveries experience detention times exceeding two hours.
Staying on top of preventive maintenance is essential to extending vehicle lifespan and cutting repair costs. Fleet management software can streamline this process, automatically calculating and tracking utilisation. Advanced telematics systems, like those from GRS Fleet Telematics, even send real-time alerts when vehicles are due for maintenance. These tools ensure fleets operate efficiently across the UK, reducing downtime and keeping operations running smoothly.
Real-time alerts make it easier to take immediate corrective action.
Using Utilisation Metrics to Improve Fleet Performance
Building on the key metrics discussed earlier, these strategies focus on turning data insights into improved fleet performance. By analysing fleet utilisation data, inefficiencies can be identified, costs reduced, and overall performance enhanced.
Identifying Underused Vehicles and Scheduling Gaps
Fleet utilisation metrics, such as mileage, engine hours, and overall usage, can uncover inefficiencies. These insights allow for smarter vehicle allocation and scheduling. For instance, if one van remains idle 40% of the time while another is overworked, you could reassign the less-used vehicle to a branch with higher demand or allocate it to closer jobs to balance workloads.
A practical example comes from Asplundh, a company specialising in tree pruning and vegetation management. They relocate underutilised vehicles to different regions based on seasonal demand. Bryan Abott, Fleet Manager of Asplundh Australia, highlights the importance of this approach:
"We certainly don't want to be having fleet just parked up, not getting utilised. We're paying for it on a monthly basis, so [...] we'll incorporate with another business unit [to] maximise the utilisation of that piece of machinery."
Sometimes, the data also reveals assets that are no longer needed and should be retired to avoid unnecessary costs. Using fleet management software to automate tracking and analysis can make spotting these inefficiencies easier. This naturally leads to better scheduling, as optimised routes and adjusted plans help maximise vehicle usage and reduce idle time.
By addressing these gaps, businesses can not only reassign resources effectively but also achieve measurable cost savings and environmental improvements.
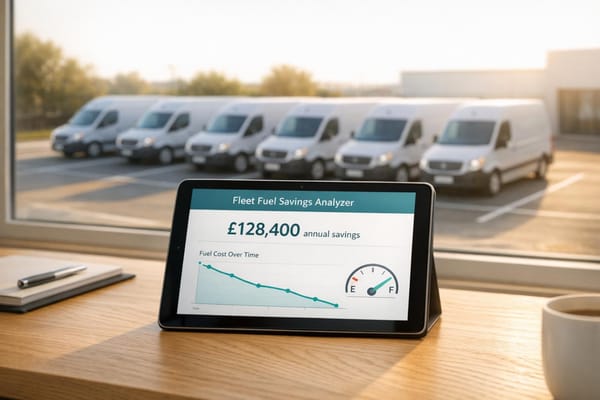
Saving Costs While Supporting Sustainability
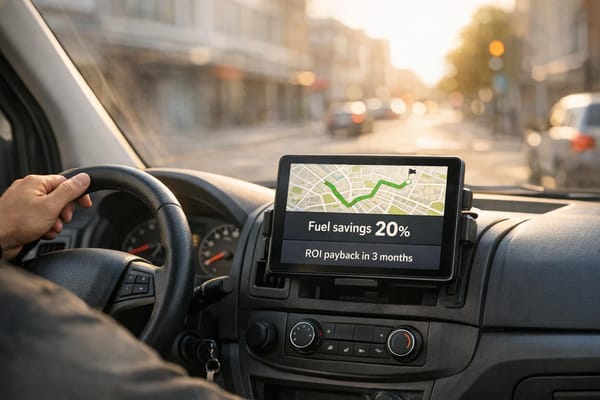
Better utilisation of fleet resources can lead to substantial cost reductions. For example, cutting down on idling saves on fuel expenses - just one idle hour per week can cost £50 per truck. Additionally, fleets using telematics have reported fuel savings of up to 14%. Juan Cardona, VP Sales, Latin America at Geotab, explains:
"The return on telematics is quite immediate, maybe about a month. Fleet managers could see 15 to 20% savings on their costs. With this, they can invest in other things for their employees."
The benefits extend beyond finances. Adopting sustainable practices can reduce fuel consumption by up to 15% through efficient route planning and vehicle optimisation. Reducing idle time by as much as 20% not only cuts costs but also lowers emissions. A great example is Old Dominion Freight Line, which introduced a driver training programme in Q3 2024. By leveraging telematics data for personalised coaching, they reduced fleet-wide fuel consumption by 8%, saving roughly £1.2 million and cutting CO₂ emissions by 10%.
For fleets transitioning to electric vehicles, the advantages grow even further. Switching to electric models can reduce greenhouse gas emissions by up to 40% compared to traditional vehicles, while also cutting fuel costs by as much as 30%.
These achievements are made possible by using real-time data, which transforms fleet management from a reactive process into a proactive one.
Leveraging Real-Time Data for Smarter Decisions
Real-time data changes the game for fleet management, allowing for proactive rather than reactive strategies. Modern telematics systems provide live updates, enabling quicker maintenance decisions and addressing issues before they become costly. Real-time GPS and diagnostics also support faster emergency responses and preventative maintenance, potentially lowering maintenance costs by up to 30%.
Take XYZ Logistics as an example. By integrating real-time telematics data into their maintenance workflows, they reduced downtime by 20% and improved fuel efficiency by 15%.
GRS Fleet Telematics offers similar capabilities, delivering continuous insights into vehicle performance through advanced tracking systems. This technology is particularly useful for route optimisation, as it accounts for traffic patterns, road closures, and other dynamic factors. With urban traffic expected to rise significantly by 2025 due to increasing back-to-office policies, this capability will be crucial for maintaining operational efficiency.
Real-time insights give fleet managers instant access to critical information about vehicle condition and performance. This empowers them to make data-driven decisions that enhance productivity and cut costs across their operations.
Advanced Methods: Capacity Planning and Forecasting
Stepping beyond the limits of reactive fleet management, businesses can now use advanced analytics and forecasting tools to predict future needs and fine-tune capacity planning. By building on real-time telematics data, these methods shift fleet management from a reactive process to a strategic advantage, turning daily operations into a forward-thinking approach.
Data Analytics for Demand Forecasting
Predictive analytics allows fleet managers to anticipate demand patterns and allocate resources more effectively. By examining historical sales data, market trends, and external influences, businesses can predict fleet requirements with impressive accuracy - AI-driven models boast forecasting accuracy rates as high as 95%. This enables a "just-in-time" fleet management strategy, cutting waste while ensuring sufficient capacity.
ETL (Extract, Transform, Load) processes play a key role by standardising data from telematics, maintenance logs, and demand trends, ensuring forecasts stay up-to-date and reliable.
In 2023, a major automotive manufacturer showcased the power of this approach, implementing a predictive analytics system that boosted production efficiency by 40%. Similarly, fleet operators can use insights from historical data, seasonal trends, and market shifts to predict future needs, allowing them to make proactive adjustments instead of reacting to problems as they arise.
Scenario Modelling for Fleet Optimisation
Forecasting is just the beginning. Scenario modelling takes it a step further, letting managers simulate and evaluate different operational strategies. Using advanced simulation platforms, they can test and compare variables like fleet size, vehicle types, and dispatch algorithms to find the best solutions.
For instance, an express delivery company handling around 1 billion shipments daily across 70,000 pickup points used AI and machine learning for dynamic route creation. This advanced scenario modelling resulted in 97–98% vehicle capacity utilisation, slashing vehicle requirements by 60%. They managed usual order volumes with 70% fewer planning resources and reduced driver needs by 40%.
Key factors for effective scenario modelling include day-to-day demand shifts, seasonal fluctuations, vehicle configurations, and infrastructure needs. By generating multiple scenarios, fleet managers can uncover the most efficient strategies for various conditions.
Dashboards and Automated Alerts
After identifying optimal strategies, real-time dashboards and automated alerts ensure operations stay on track. Dashboards act as the nerve centre of modern fleet management, consolidating data from GPS systems, telematics, maintenance logs, and compliance tools into actionable insights. These tools turn raw data into strategic intelligence, helping businesses make better decisions, cut downtime, and boost profitability.
The impact is clear: companies using centralised fleet dashboards have reported a 23% reduction in vehicle downtime.
Automated alerts enhance these dashboards by sending proactive notifications when critical metrics - like engine performance, route deviations, or maintenance needs - hit predefined thresholds. This enables teams to respond quickly to prevent issues. Customisable dashboards and alerts empower fleet managers to take immediate corrective actions, streamlining operations and improving efficiency.
The integration of GRS Fleet Telematics with advanced dashboard systems provides continuous insights into vehicle performance. This combination of forecasting, scenario modelling, and real-time monitoring strengthens fleet management, driving efficiency and optimising performance like never before.
Comparison Table: Benefits and Limitations of Core Utilisation Metrics
Understanding the strengths and weaknesses of each metric is crucial for choosing the right tools to measure fleet performance. While each metric provides specific insights, no single one tells the whole story. A well-rounded approach that combines multiple metrics is the most effective way to gain a complete picture.
Metrics Comparison
Here’s a breakdown of the purpose, advantages, and challenges of key fleet utilisation metrics:
| Metric | Purpose | Benefits | Limitations |
|---|---|---|---|
| Vehicle Utilisation Rate | Tracks the percentage of time vehicles are actively used compared to their total availability. | Highlights underused assets, helping with better resource allocation and scheduling. | Doesn’t account for differences in job types, demand variations, or actual cargo usage. |
| Fleet Capacity | Measures how efficiently cargo space or passenger capacity is utilised. | Enhances load planning, reduces empty miles, and increases revenue per trip. | Difficult to evaluate in mixed cargo scenarios or when dealing with weight limits and special handling needs. |
| Cost per Mile | Calculates operational costs in relation to distance travelled. | Offers clear insights into profitability, supports route planning, and identifies cost-saving opportunities. | May oversimplify complex job types and could encourage longer, less efficient routes. |
| Fuel Efficiency | Tracks fuel consumption relative to distance or operating hours. | Reduces operational costs - fuel often accounts for 24% of overall expenses - and aligns with environmental goals. | External factors like traffic and weather can skew results, and it doesn’t always reflect overall productivity. |
| Downtime Percentage | Monitors the time vehicles are unavailable due to maintenance or repairs. | Aids in maintenance planning, minimises breakdowns, and ensures higher vehicle availability. | Fails to distinguish between planned and unplanned downtime or assess the severity of issues. |
No single metric can fully capture the complexities of fleet performance. This is why combining metrics is essential for a balanced and accurate assessment. For example, the global fleet management industry has seen rapid growth, doubling in value from approximately £10.8 billion in 2017 to around £22.5 billion today. This expansion reflects the increasing challenges of optimising operations.
Time-based metrics like vehicle utilisation rates are excellent for spotting scheduling issues, but they might not reveal whether vehicles are being used effectively to carry loads. For instance, a vehicle could be active for most of its available time but still underperform in terms of cargo utilisation.
Similarly, distance-based metrics such as cost per mile provide valuable financial insights but may overlook the complexities of urban deliveries, where shorter routes often involve more intricate operations or higher-value services. Capacity metrics, while useful for load planning, can be complicated by factors like mixed cargo or weight restrictions.
The most effective strategy is to use a balanced scorecard approach, combining these metrics to create a comprehensive view of performance. Tools like GRS Fleet Telematics make this process easier by tracking multiple metrics simultaneously. These systems provide real-time data and can distinguish between issues like traffic delays, customer-related waiting times, and genuine operational problems, giving fleet managers the insights they need to make informed decisions.
Conclusion
Summing up the metrics and strategies discussed earlier, it’s clear how these tools can boost fleet performance. Metrics like vehicle utilisation rate, fleet capacity, cost per mile, fuel efficiency, and downtime percentage are more than just numbers - they turn raw data into practical insights, helping businesses fine-tune operations and manage costs more effectively.
The formulas provided throughout this guide offer straightforward ways to measure fleet performance. Whether it’s determining the percentage of time vehicles are in use or calculating fuel consumption per mile, these tools help organisations make data-driven decisions. For many, aiming for a fleet utilisation rate of 80% or higher serves as a solid benchmark for assessing efficiency and performance.
Accurate tracking of these metrics doesn’t just cut costs - it also contributes to reducing the environmental impact. By focusing on vehicle hours, minimising unnecessary travel, and reducing idling, businesses can make strides in both efficiency and sustainability.
Telematics plays a pivotal role here, enabling constant monitoring of key performance indicators. With real-time data collection, fleet management shifts from a periodic task to an ongoing process, allowing for immediate adjustments and sustained operational improvements.
Key Takeaways
No single metric can provide a complete picture of fleet performance. Instead, a balanced approach that combines various metrics is essential. Time-based metrics help identify scheduling inefficiencies, distance-based measurements uncover cost-saving opportunities, and capacity metrics ensure resources are used effectively.
Telematics systems are indispensable in today’s fast-paced environment. Solutions like GRS Fleet Telematics offer tools for route optimisation, idle time tracking, and driver safety monitoring. These features allow businesses to act on insights immediately, rather than waiting for monthly reports.
Regular reviews and adjustments are critical for keeping fleet performance on track. As market conditions shift and business needs evolve, utilisation metrics can highlight when it’s time to adjust fleet size - whether by adding vehicles or redistributing existing ones.
The 80% utilisation benchmark provides a realistic target for many industries, though the ideal rate may vary depending on specific operational needs. Using industry-appropriate benchmarks alongside proven formulas ensures consistent and meaningful performance evaluations.
Lastly, proactive maintenance tracking is vital. Monitoring downtime percentage helps avoid small issues escalating into major problems, ensuring that high utilisation rates don’t compromise vehicle reliability. This balance between maximising asset usage and maintaining fleet health is key to long-term success.
These strategies lay the groundwork for continuous improvement and innovation in fleet management.
FAQs
How do telematics systems improve the accuracy of fleet utilisation metrics?
Telematics systems take fleet utilisation tracking to the next level by delivering real-time data on vehicle locations, usage patterns, and performance metrics. This eliminates the hassle and inaccuracies of manual data entry, ensuring you get dependable insights every time.
Equipped with GPS tracking and advanced vehicle diagnostics, telematics lets fleet managers keep an eye on essential metrics like mileage, idle time, and driver behaviour. This level of detail helps businesses fine-tune fleet operations, spot underused vehicles, and make smarter decisions to boost overall performance.
Using telematics gives businesses a sharper view of how their fleet is being utilised, paving the way for reduced costs and smoother operations.
How can fleet managers increase vehicle utilisation in a mixed fleet?
Improving how a mixed fleet is used comes down to smart planning and making the most of available technology. A good starting point is diving into telematics data. This helps fine-tune routes and schedules, ensuring vehicles are used effectively and downtime is kept to a minimum.
It’s also worth taking a closer look at the size and make-up of your fleet. Aligning it with actual usage patterns can cut down on underused vehicles and trim unnecessary costs. Adding fleet management tools into the mix - tools that offer real-time tracking and maintenance reminders - can further boost efficiency. These systems help reduce excessive idling, keep vehicles in good shape, and make them more readily available when needed.
Using these approaches, fleet managers can improve day-to-day operations and keep costs under control.
How does real-time data support sustainable fleet management in the UK?
Real-time data is a game-changer for managing fleets in a way that's both efficient and environmentally conscious. By using this data, businesses can fine-tune routes to avoid unnecessary detours, slash fuel consumption, and lower emissions. It also provides instant updates on vehicle health, enabling proactive maintenance that helps prevent breakdowns and keeps operations running smoothly.
With real-time insights, fleet operators can achieve a dual benefit: reducing their environmental footprint while trimming operational costs. This not only aligns with sustainability goals but also boosts the fleet's overall performance and reliability.