Fleet Performance Tracking Systems: AI Guide
AI fleet tracking slashes fuel waste, predicts faults and cuts theft risk—practical checks on hardware, GDPR and pilots for UK fleets.
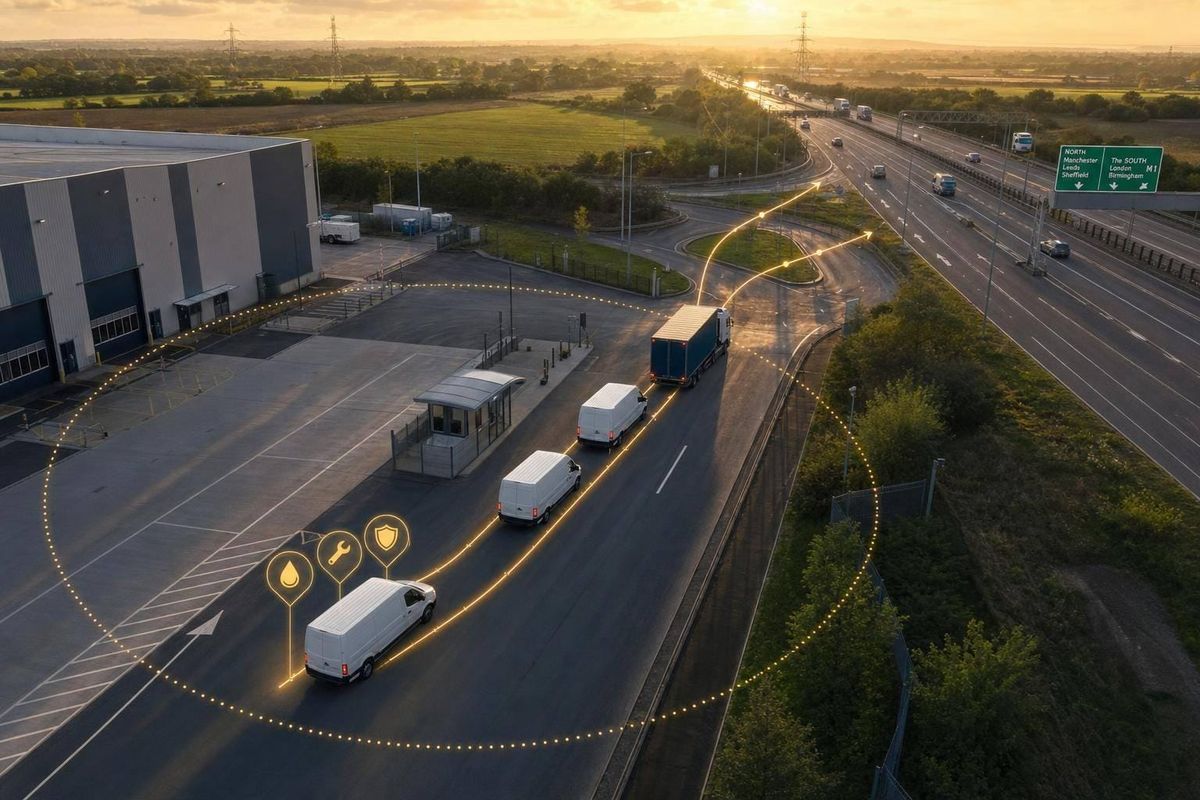
If I had to sum it up in one line: AI fleet tracking helps you cut fuel waste, spot vehicle issues early, reduce theft risk, and coach drivers with live data.
In this guide, I’d look at the parts that matter most before buying or rolling out a system in the UK: trackers, CAN and OBD data, cameras, dashboards, alerts, driver scoring, maintenance planning, theft controls, GDPR checks, pilots, and ROI.
A few numbers show why this matters:
- 9,522 vans were stolen in 2025 in the UK
- Unplanned vehicle downtime can cost about £2,976 straight away
- A fleet vehicle may idle for 1 hour 25 minutes per day
- In a 50-vehicle fleet, idle fuel waste can hit about £21,000 a year
- Predictive maintenance can cut breakdowns by 30–50% and maintenance spend by 20–30%
Here’s the simple takeaway:
- Basic GPS shows where a vehicle is
- AI tracking shows what is going wrong, what may go wrong next, and what to do about it
- The best setups mix live location, engine data, driver behaviour, fuel records, and camera events
- Before rollout, I’d check hardware fit, data quality, security, GDPR, integrations, and pilot results
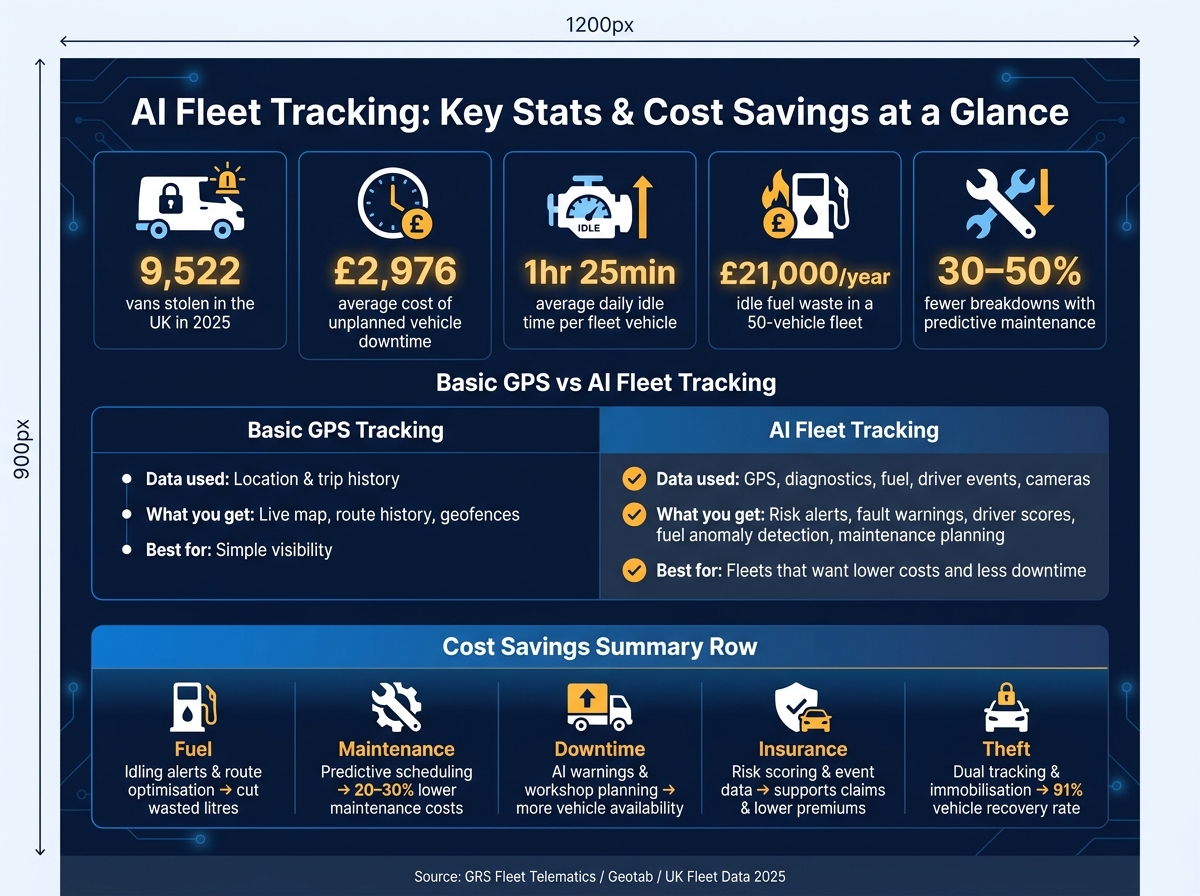
AI Fleet Tracking: Key Stats & Cost Savings at a Glance
What Smart Fleets Are Doing Differently with AI
sbb-itb-499a7f0
Quick comparison
| System type | Main data used | What you get | Best for |
|---|---|---|---|
| Basic GPS tracking systems | Location and trip history | Live map, route history, geofences | Simple visibility |
| AI fleet tracking | GPS, diagnostics, fuel, driver events, cameras | Risk alerts, fault warnings, driver scores, fuel checks, maintenance planning | Fleets that want lower cost and less downtime |
If you run vans, cars, HGVs or mixed assets, this guide gives you a clear view of what to check, what the numbers can look like, and where AI tracking can pay off fastest.
The core system: devices, data and AI processing
Tracking devices and in-vehicle hardware
Once the hardware is in place, the system can turn live vehicle data into something you can actually use.
Hard-wired trackers connect straight to the power supply, ignition or CAN bus. They’re harder to tamper with, stay on all the time, and work well for long-term assets such as vans, HGVs and plant where dependable tracking matters most.
OBD-II plug-in units fit into the diagnostics port in minutes. That makes them a good match for cars and light commercial vehicles where fast installation and easy redeployment are the priority. The downside? They’re easier to remove and often report data less frequently than a hard-wired unit.
CAN-connected devices read data from the vehicle’s own network. That gives access to RPM, fuel level, door status, engine hours and diagnostic trouble codes. For modern Euro 6+ vehicles, and for fleets that want a closer look at performance and vehicle health, that level of detail can make a big difference.
Add-on sensors such as temperature probes, fuel-level probes and accelerometers bring in extra context around cold-chain conditions, theft risk and driving behaviour.
Camera-based hardware takes this a step further. That can be anything from a basic dashcam to a multi-camera DVR system. Alongside video evidence, these systems can support AI-based event detection by flagging distraction and tailgating. For fleets that need fast incident review, that extra layer of data is hard to ignore.
For security, dual-tracker setups matter in the UK because van theft remains a major issue. A visible tracker paired with a hidden backup helps keep data flowing if the main unit is removed. That means performance data can still come through even if the vehicle is targeted. GRS Fleet Telematics uses this setup across its hardware tiers and states a 91% recovery rate for stolen vehicles.
Data sources that feed AI models
AI output is only as good as the data going in. The main inputs usually include GPS journey data, mileage, speed events, engine diagnostics, fault codes and fuel card transactions. Camera systems with Driver Monitoring System (DMS) and Advanced Driver Assistance Systems (ADAS) add yet another stream of data.
This is where data quality can make or break the system. A poorly drawn geofence, an old route plan or mismatched driver IDs can lead to bad scores and false alerts. After a while, people stop trusting what the platform tells them.
A few practical fixes go a long way:
- Keep service records digitised and linked to each vehicle
- Reconcile fuel card data with telematics location and odometer readings
- Maintain accurate driver profiles, including role type
That last point matters more than it may seem. An inner-city multi-drop driver should not be judged against a motorway line-haul driver as if they’re doing the same job. Like-for-like comparisons give the AI a fairer basis for scoring.
Edge processing, cloud analytics and integrations
Modern fleet platforms split the workload between the vehicle and the cloud. For UK operators, that split matters, especially when vehicles pass through areas with weak mobile coverage.
Edge processing happens inside the vehicle. The device samples accelerometer and GPS data at high frequency, spots events such as a collision threshold being crossed, and stores data locally if the signal drops. So if a van is driving through rural Scotland, it doesn’t lose the event data that matters most. It simply stores it and sends it on when coverage returns. There’s another upside too: batching routine data can help cut SIM costs.
Cloud analytics take care of the heavier lifting. That includes training and running machine learning models, scoring drivers across the fleet, predicting component wear and spotting fuel-use anomalies. Trend-based insight, such as estimating when parts may need attention based on mileage, load and past failure data, needs larger datasets and central processing to be useful.
Integrations often bring the biggest day-to-day gain. If a maintenance alert from CAN diagnostics flows straight into a workshop job card, or telematics start-stop data feeds driver timesheets in the payroll system, admin work drops sharply. Before rollout, it’s worth checking how telematics APIs integrate with pre-built connectors for workshop, fuel and routing systems.
These outputs feed the dashboards, alerts and driver scores covered next.
How fleet managers use dashboards, alerts and driver scoring
Dashboards and KPIs that matter
Once data starts coming in from devices and diagnostics, the dashboard is where it turns into action. A good fleet dashboard gives managers one clear view of what matters: which vehicles are moving, which are sitting idle, which have active faults, and which are due a service. The point isn't to show every single data point. It's to flag issues before they turn into bigger, more expensive problems.
The day-to-day gap between a standard telematics dashboard and an AI-enhanced one is context. A standard dashboard might show total idle time across the fleet. An AI-enhanced system goes further and shows where that idling is piling up - by depot, shift, or vehicle type - so managers can see where to step in first.
| Metric | Traditional view | AI-enhanced view | Operational benefit |
|---|---|---|---|
| Vehicle location | Live map only | Live map plus route deviation warnings and ETA confidence | Better dispatch |
| Idle time | Total minutes idling | Idle hotspots by depot, shift, and vehicle | Lower fuel waste |
| Faults | Fault-code list | Fault-code trends plus predicted failure risk | Earlier maintenance |
| Safety | Harsh-event counts | Drivers ranked by risk and trend patterns | Sharper coaching |
| Utilisation | Trip counts and mileage | Under-use and over-use by asset | Smarter fleet sizing |
| Fuel use | Consumption totals | Excess consumption linked to route, driving style, or theft anomalies | Stronger cost control |
For UK operators, it helps to show costs as £ per mile or £ per vehicle per month. That's the kind of number managers can act on straight away.
Real-time alerts and predictive warnings
AI can cut down alert overload by ranking events by risk. That means managers can step in before downtime or safety issues spread across the fleet. A one-off speed exceedance doesn't matter nearly as much as repeated speeding on the same route. AI helps sort that out by grouping related events and muting low-value notifications, so operations and maintenance teams spend time on the alerts that need a response.
A tiered alert model works well here:
- Critical alerts - severe speeding, harsh events, out-of-hours vehicle movement, or geofence breaches - should go out at once by SMS or push notification.
- Lower-priority issues, such as mild idling or small route deviations, can go into digest emails or dashboard widgets for later review.
| Alert category | Example trigger | Data source | Recommended fleet response |
|---|---|---|---|
| Safety | Repeated harsh braking within one week | Accelerometer, speed, trip data | Coach the driver and review routes |
| Security | Vehicle movement outside approved hours | GPS, ignition, geofence data | Verify authorisation and check for theft |
| Maintenance | Engine fault code plus rising temperature | OBD/CAN diagnostics, sensor data | Book inspection before breakdown |
| Utilisation | Excessive idling on depot return | Engine-on time, trip logs | Review dispatch and loading practices |
| Fuel | Tank-level drop not matched by GPS movement or fuel card records | GPS, fuel card, tank sensor | Trigger immediate review for suspected fuel theft |
Those alerts also feed straight into analysing driver behaviour and coaching.
Driver behaviour scoring and coaching
AI-based driver scoring works best when it's used for coaching, not as a punishment label. The model looks at harsh events, speeding frequency, severity, time of day, route type, and incident history to build a picture of risk over time. That weighting matters. Three harsh-braking events in stop-start city traffic shouldn't count the same as three severe events at speed on an open road.
Low scores can trigger one-to-one coaching, route or shift reviews, and refresher training. High scores can support recognition schemes that reward good habits across the fleet. If scores stay poor after coaching, they can also give managers a documented basis for policy enforcement or closer supervision. Historical score data helps with claims investigations too, because it shows driving behaviour in the run-up to an incident.
On GDPR, fleet operators need to be clear with drivers about what data is collected, why it's collected, who can access it, and how long it's kept. Scoring should stay proportionate to its purpose - safety improvement and operational efficiency - with access controls that stop personal data being seen by people who don't need it. Drivers are far more likely to engage with coaching when the scoring logic is clear and linked to behaviours they can change, rather than a black-box score.
That same risk data also helps shape maintenance priorities, covered next.
Using AI for maintenance planning and cost control
From preventive servicing to predictive maintenance
AI maintenance tracking uses live diagnostics, usage data and repair history to predict faults and time workshop visits better. In plain terms, it helps fleets act before a problem turns into a breakdown.
That creates a clear shift in how maintenance gets managed:
| Maintenance type | Data used | Pros | Limits | Likely cost impact |
|---|---|---|---|---|
| Reactive | Breakdown events, tow/repair history | No upfront planning needed | Highest downtime, emergency labour and recovery costs | Usually the most expensive option over time |
| Preventive | Mileage, calendar intervals, MOT dates | Reduces some failures and supports compliance | Can over-service healthy vehicles; may miss emerging faults | Moderate savings, but still calendar-driven |
| Predictive (AI) | Diagnostics, temperature trends, repeated fault codes, duty-cycle data | Spots failure before it happens; optimises component life | Requires good data quality and hardware investment | Lowest long-term cost |
Some analyses report 30–50% fewer breakdowns and 20–30% lower maintenance costs with predictive analytics.
But here's the part that often matters most day to day: the biggest ROI usually comes from better vehicle availability and fewer lost revenue hours, not only from smaller repair bills. A van off the road at the wrong time can cost far more than the invoice from the workshop.
Maintenance workflows that reduce downtime
Spotting risk is only half the job. The response needs to work on the ground.
Once the system flags an issue, the planner checks the fault history and upcoming jobs, orders parts, books the vehicle in, and then feeds the repair result back into the model. That turns AI from a dashboard feature into something the workshop and operations team can use.
To see if the new workflow is working, focus on three numbers:
- planned versus unplanned jobs
- downtime per incident
- mean time between failures (MTBF) for critical components
Many fleets aim to push planned work above 70–80% of all events within 12–18 months. That matters because scheduled interventions usually take 4–6 hours, while reactive callouts often take 10–12 hours.
That's a big difference. One job fits into the day. The other can wreck a shift.
Cost control, ROI and theft-related savings
Maintenance is only one part of the money story. Fuel, downtime, insurance and theft all hit the same bottom line.
Geotab reports that the average fleet vehicle idles for 1 hour 25 minutes per day, burning about 3.60 litres of fuel in the process. Across a 50-vehicle fleet, avoidable idle fuel waste can reach about £21,000 per year.
Theft adds another layer of cost. Losing a vehicle can mean tens of thousands of pounds in replacement spend, lost revenue and claims friction. Dual-tracker hardware, remote immobilisation and recovery support can improve recovery odds and lower write-off risk. If an insurer recognises Thatcham-approved tracking and immobilisation, that setup may also help with lower premiums and smoother claims handling.
| Cost category | AI lever | Savings mechanism |
|---|---|---|
| Fuel | Idling alerts, route optimisation and driver behaviour analytics | Cuts wasted litres from unnecessary idling and inefficient journeys |
| Maintenance | Predictive scheduling and exception alerts | Prevents major failures through early detection; optimises component life |
| Downtime | AI warnings, parts ordering and workshop planning | Increases vehicle availability and reduces lost revenue hours |
| Insurance | Risk scoring and event data | Supports claims defence and can contribute to lower premiums |
| Theft | Dual tracking, immobilisation and 24/7 recovery support | Improves recovery odds and reduces write-off risk and replacement costs |
That sets up the next step: checking hardware fit, data readiness and security before rollout.
What fleet buyers should check before rollout
Requirements, compliance and data readiness
Before rollout, turn those expected gains into a short buyer checklist: data quality, operational fit, security, and compliance.
Pick three to five clear business outcomes. That might mean lower fuel cost per mile, fewer unplanned workshop visits, or a drop in accident rates. Then give each one a KPI you can track. Capture baseline figures for those metrics three to six months before go-live so later comparisons are based on actual performance, not guesswork.
At the same time, review your data. Match odometer readings, fuel card records, and service history to each vehicle ID before go-live. If mileage, fuel, or vehicle ID data is wrong, the system’s alerts will be off from the start.
GDPR also needs attention early. You need a lawful basis, a DPIA for large-scale monitoring, and clear privacy notices before deployment. Bring in HR and legal before contracts are signed, not at the last minute. Then check those points again during a limited pilot before moving to the full fleet.
Evaluating hardware, platform fit and security features
Make sure the hardware matches each vehicle type, lease term, and insurance requirement.
The platform should also report in miles, mpg, and £. On the security side, check for dual tracking, tamper detection, and immobilisation. Those aren’t nice extras. For many fleets, they’re part of the basic fit.
Pilot and rollout
Once you’ve chosen a system, test it on a small fleet before you commit across the business.
Run a pilot on a representative sample. Include a mix of urban delivery vans, regional vehicles, and any high-risk assets. Keep it running for eight to twelve weeks before making a fleet-wide decision. Set clear KPIs for the pilot, hold weekly review meetings, and adjust alert thresholds and score settings based on what you see. Start with conservative thresholds so teams don’t get buried in alerts while the system is still being calibrated.
Training is often where rollout slows down. Drivers need to know how their scores are worked out and that the aim is coaching, not surveillance. Planners need to understand which maintenance alerts need action and which ones can wait. Workshop teams need to see how predictive warnings fit into their booking flow. It helps to name a driver lead, planner lead, and workshop lead who can answer questions and share early wins. That tends to make adoption much smoother.
Before full deployment, confirm four things:
- Security features have been tested
- Integrations with your TMS and workshop systems are working
- GDPR documentation is complete
- Projected ROI, shown as £ per vehicle per year, is based on pilot results rather than vendor estimates
FAQs
How does AI fleet tracking differ from basic GPS?
Basic GPS usually tells you two things: where a vehicle is and where it’s been. AI-powered fleet tracking goes a step further. It analyses data in real time and combines location data with inputs like engine diagnostics, accelerometer readings, and traffic data.
That means the system doesn’t just collect raw information. It turns it into actions a business can use straight away, such as maintenance alerts, driver scorecards, and notifications when a vehicle leaves a geofenced area or shows risky behaviour.
The result is a shift from reactive monitoring to smarter, money-saving decisions.
What data does an AI fleet tracking system need?
An AI fleet tracking system runs on a steady flow of clean, connected data from telematics devices, vehicle sensors and outside sources.
That usually means pulling in vehicle and engine diagnostics, driving behaviour, GPS location, journey history, traffic data, weather data and maintenance records. The picture gets sharper when you match that with internal records such as fuel card transactions, odometer readings and maintenance invoices.
How long should a fleet tracking pilot run?
Track performance metrics for at least three months before implementation so you have a clear baseline to work from.
After launch, compare results at 3, 6 and 12 months. That gives you a fairer view of what’s changed over time, especially when seasonal shifts can affect maintenance demand and fuel use. It also makes it easier to measure changes in fuel efficiency, idle time and maintenance costs against your baseline.