Fleet Data Analytics: Custom Driver Dashboards Guide
Custom driver dashboards transform fleet data into actionable insights, improving performance, reducing costs, and ensuring compliance.
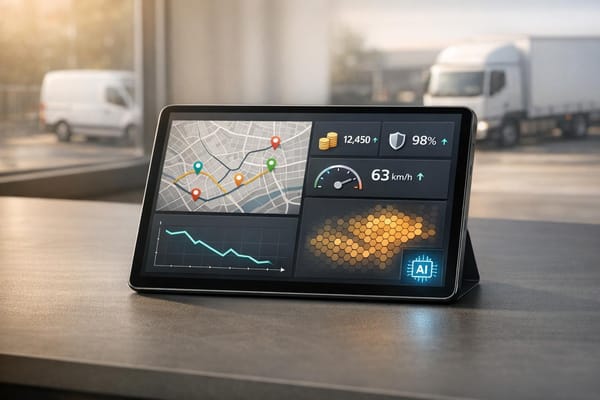
Fleet data analytics simplifies complex vehicle and driver data into actionable insights. Custom driver dashboards play a key role by presenting critical metrics like fuel consumption, driver behaviour, and maintenance needs in clear, visual formats. These tools help UK fleet managers improve performance, reduce costs, and ensure compliance with regulations.
Key Takeaways:
- What They Do: Dashboards consolidate telematics data into easy-to-read KPIs.
- Why They Matter: They help tackle challenges like rising fuel costs, emissions rules, and road safety.
- How They Help: Dashboards improve accountability, simplify compliance, and enable proactive decision-making.
- Building Them: Use platforms like Power BI or GRS Fleet Telematics for real-time data integration and customisation.
- Metrics to Track: Safety events, fuel efficiency, idling time, and driver scores.
- Visuals to Use: Bar charts, line graphs, and heat maps for clear data presentation.
With structured data and the right tools, these dashboards transform fleet management, helping businesses optimise efficiency and reduce expenses.
🚚 Power BI Fleet Management Dashboard – Exclusive Preview! 📊
Preparing Your Fleet Data for Dashboards
To make dashboards work effectively, you need to gather and organise your fleet data properly. Poorly structured data leads to unreliable insights, so it’s crucial to consolidate information from various sources and arrange it in a way that enables meaningful analysis. Let’s break down how to collect and structure your data for effective benchmarking.
Collecting Fleet Data
The backbone of any useful dashboard is thorough data collection from all available sources. While your telematics system provides real-time information on vehicle location, speed, fuel consumption, and driver behaviour, it’s just one piece of the puzzle. To get the full picture, you’ll need to combine it with data from other areas:
- Fuel transaction data: Include purchase dates, locations, quantities (litres), and costs (£).
- Maintenance records: Track service dates, costs, parts used, and vehicle downtime.
- Driver records: Capture licence details, incident reports, and performance evaluations for coaching and analysis.
One common challenge for fleet operators is managing data stored across separate systems - telematics in one, fuel cards in another, and maintenance records in spreadsheets. To overcome this, consider integration tools that link these systems or a platform capable of handling multiple data types. Once all the data is collected, it needs to be structured in a way that supports meaningful comparisons.
For example, GRS Fleet Telematics simplifies this process by combining vehicle tracking, security monitoring, and performance metrics into a single system. This eliminates the need for manual data consolidation and reduces the risk of errors.
Organising Data for Benchmarking
How you organise your data directly impacts the clarity and usefulness of your dashboards. Proper organisation allows for effective benchmarking, helping you measure performance and spot areas for improvement.
Vehicle segmentation is key for accurate comparisons. Simon Turner, Campaign Manager for Driving for Better Business, explains:
"We've pulled together a group of fleet experts to design a set of metrics that most organisations would be able to work with – information they should readily have to hand. Our benchmarking tool then converts that information into ratios that are easily comparable with other fleets".
To ensure fair comparisons, group vehicles by type - such as powered two-wheelers, cars, vans and light commercial vehicles (LCVs), heavy goods vehicles (HGVs), and passenger-carrying vehicles (PCVs).
Operational context adds another layer of depth. Factors like fleet size, industry type, and geographic location significantly influence performance metrics. For instance, a delivery fleet in central London deals with very different conditions compared to one in rural Scotland. Capturing these operational details ensures that benchmarking results are relevant and meaningful.
Time-based organisation is essential for tracking trends and long-term progress. Structure your data to allow comparisons across multiple years. For instance, the Driving for Better Business benchmarking system:
"offers the option to save up to three consecutive years of data and results so that fleet and transport managers can track the trends in their business over time".
Key performance indicators (KPIs) should be categorised clearly. Examples include fuel consumption (litres per 100 kilometres), fuel economy (miles per gallon), idling time (percentage of total operating time), harsh driving events (per 1,000 kilometres), vehicle utilisation rates, driver behaviour scores, and maintenance costs (per mile). Organise these metrics to allow filtering by factors like vehicle type, route, or region.
Driver profiles also need careful structuring. Group data to identify patterns in behaviours like harsh acceleration, unnecessary idling, and hard braking. This allows for targeted coaching and highlights top-performing drivers who can mentor others.
Finally, ensure your data organisation complies with GDPR by implementing access controls and audit trails to protect sensitive information.
When data is well-organised, it becomes more than just numbers - it’s a powerful tool for both immediate decision-making and long-term strategy. With structured data, your dashboards can provide actionable insights that drive continuous improvement.
Key Metrics and Charts for Driver Benchmarking
Dashboards are only effective if they use metrics that inspire improvement and present data in a way that drives action.
Core Driver Performance Metrics
Safety metrics are the cornerstone of any driver benchmarking system. Monitoring harsh driving events - like rapid acceleration, hard braking, or sharp cornering - can highlight risky behaviours and potential accident risks. To ensure fair comparisons, express these incidents as events per 1,000 kilometres. Speeding violations should be categorised by severity: minor (1-10 mph over the limit), moderate (11-20 mph over), and serious (over 20 mph above the limit).
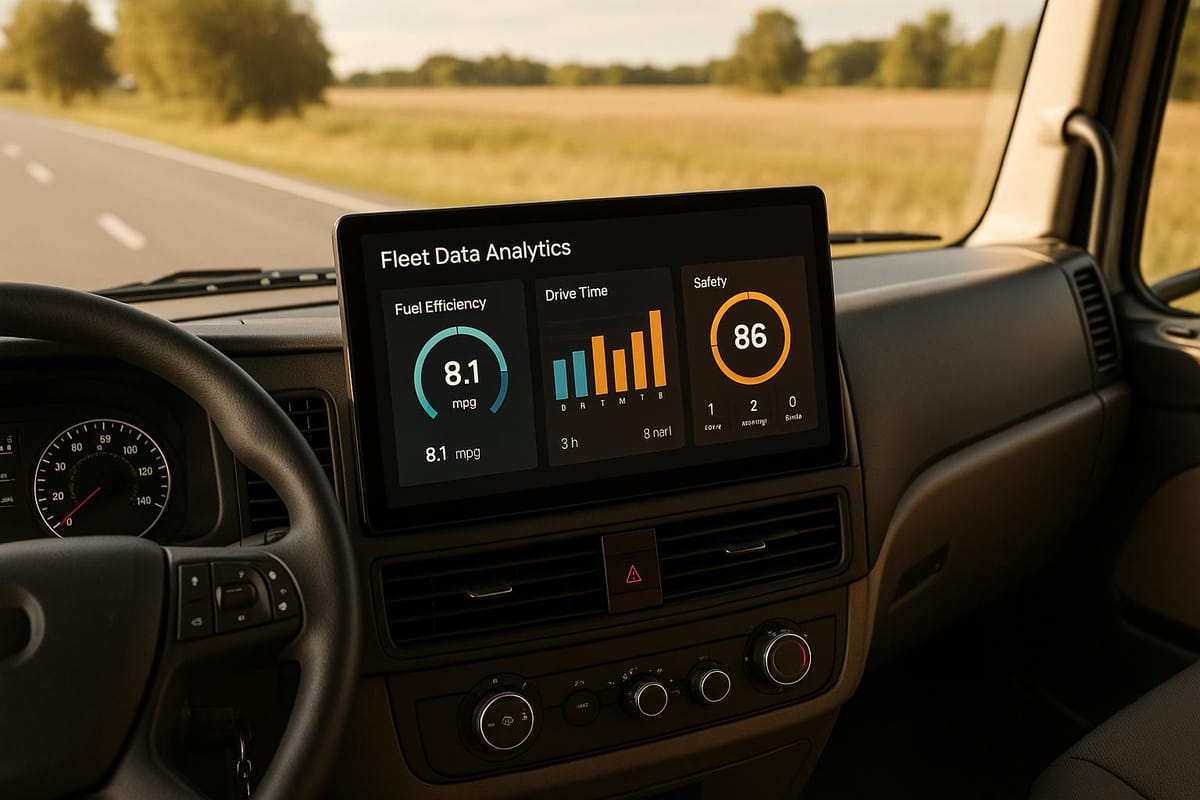
Fuel efficiency is a top priority for UK fleets, especially with rising fuel prices. Present fuel consumption in both litres per 100 kilometres for precision and miles per gallon for familiarity. This dual format helps drivers easily understand their performance while maintaining analytical consistency. Comparing fleet-wide averages to the gap between your best and worst performers can uncover significant opportunities for improvement.
Operational efficiency metrics measure how effectively drivers utilise their time and vehicles. Metrics like idling time - expressed as a percentage of total engine-on time - highlight unnecessary fuel consumption and emissions. Vehicle utilisation rates show productive work versus scheduled hours, while journey time accuracy (planned vs. actual arrival times) reflects the efficiency of route planning and reliability in meeting customer expectations.
Driver behaviour scores consolidate various factors into a single, easy-to-interpret figure. These scores often include speeding incidents, harsh driving events, mobile phone use while driving, and seatbelt compliance. A score out of 100 provides a straightforward way for drivers to track their performance and progress.
Cost-related metrics link driver behaviour to financial outcomes. Metrics such as fuel costs per mile, maintenance expenses tied to driving style, and insurance claims frequency can justify investments in driver training and highlight the financial benefits of using dashboards.
Environmental metrics are increasingly critical for UK fleets navigating emissions regulations and clean air zone charges. Track CO2 emissions per kilometre, NOx levels in urban areas, and particulate matter output. These figures are particularly relevant in cities like London, Birmingham, and Manchester, where stringent emissions standards apply.
Once these core metrics are established, the next step is selecting the most effective visual formats to present this data.
Selecting the Right Chart Types
For UK fleet operators, clear data presentation is key to actionable insights. The way metrics are displayed can determine whether drivers and managers engage with the information or overlook it.
Bar charts are ideal for comparing driver performance across the fleet. Use horizontal bars to rank fuel efficiency or safety scores, with colour coding - green for top performers, amber for average, and red for underperformers - to make the data visually intuitive.
Line graphs are perfect for tracking trends over time, such as improvements after training or policy updates. Weekly or monthly averages are better than daily data to avoid unnecessary noise. A three-month rolling average can smooth out anomalies while still showing meaningful patterns.
Heat maps allow you to assess performance across multiple dimensions simultaneously. For example, you could create a grid with drivers on one axis and metrics on the other, using colour intensity to represent performance levels. This format quickly identifies drivers who consistently underperform or excel in specific areas.
Gauge charts are effective for individual dashboards, showing current performance against targets. However, they should be used sparingly to avoid visual clutter. Reserve them for critical metrics like overall safety scores or fuel efficiency.
Tables are essential for detailed analysis, particularly for managers who need precise figures. Organise tables by performance rankings and include percentage changes from previous periods. Use alternating row colours and clear column headers to maintain clarity.
Scatter plots can reveal relationships between metrics that other charts might miss. For instance, plotting fuel efficiency against average speed could show whether faster driving leads to higher fuel consumption.
When choosing chart types, consider your audience. Driver-facing dashboards benefit from simple visuals like bar charts and gauges for quick insights. Management dashboards, on the other hand, can include more complex visuals like heat maps and scatter plots to uncover deeper trends.
Mobile compatibility is another important factor. Simple visuals like bar charts and line graphs are easier to interpret on smartphones, while more intricate formats like heat maps may not translate well to smaller screens. Focus on charts that remain clear and effective on mobile devices.
Accessibility should never be overlooked. Use colour schemes that are friendly to colour-blind users, include clear labels and legends, and ensure strong contrast between elements. These steps aren’t just practical - they’re essential for ensuring that everyone on your team can benefit from the insights your dashboards provide.
How to Build Custom Driver Dashboards
Now that we've covered the key metrics and visualisations, let’s dive into the process of creating a custom driver dashboard. A well-designed dashboard relies on the right platform, thoughtful customisation, and automated updates to ensure it provides accurate, real-time data.
Choosing the Right Dashboard Platform
The first step in building a driver dashboard is selecting the right platform. For smaller fleets, a straightforward tool like Microsoft Excel may suffice for basic dashboards. Larger fleets, however, often require more advanced platforms like Power BI or Tableau, which provide real-time data integration and scalability.
When deciding on a platform, think about your team’s technical skills and budget. A highly complex tool might be underutilised, while a simpler, user-friendly system is more likely to be updated and monitored consistently. Integrated solutions, such as those provided by GRS Fleet Telematics, can streamline the process by automatically updating dashboards tailored to UK fleet operations using data from van trackers.
Customising Dashboard Layouts and KPIs
Customisation is key to creating dashboards that are both effective and user-friendly. Start by understanding who will use the dashboard and how they’ll interact with the data. For driver-focused dashboards, simplicity and clarity should be the top priorities. Place the most critical metric - such as an overall performance score - prominently at the top of the dashboard, followed by detailed insights into areas that may need improvement.
Use UK-specific formatting: currency in £, dates in DD/MM/YYYY, and display measurements in both metric and imperial units. Colour coding can make the data more intuitive, with green indicating strong performance, amber signalling caution, and red highlighting issues that require immediate attention.
Ensure the layout has a clear visual structure, is mobile-friendly, and allows drivers to customise which metrics they see. Once the layout is set, the next step is to make the data actionable by incorporating automated alerts.
Adding Automated Alerts and Updates
Automated alerts turn dashboards from static displays into proactive management tools. These alerts can notify users of key safety and performance metrics, such as harsh braking or a drop in fuel efficiency, prompting timely reviews and actions.
Set up alerts to distinguish between critical and non-critical issues. For example, urgent problems can trigger immediate notifications, while less pressing matters can be summarised in regular reports. Maintenance alerts can help manage costs and ensure compliance with deadlines, while geofence alerts notify managers if a vehicle leaves a designated area or remains stationary unexpectedly.
Performance trend alerts are particularly useful for spotting gradual changes in metrics, allowing you to address issues before they escalate. Automated updates also ensure your dashboards stay relevant. Daily summaries can help with operational tracking, weekly reports are ideal for strategic planning, and periodic comprehensive dashboards are perfect for reviewing policies and training programmes.
Using Dashboard Data to Improve Fleet Performance
Once your dashboards are up and running, the real value lies in turning the insights they provide into actionable strategies. A dashboard is only as useful as the steps you take based on the data it presents.
Reading Data for Benchmarking
Start by establishing a benchmark for your fleet's performance using historical data. This baseline helps you identify anomalies and areas that require attention.
For instance, if a new driver's fuel consumption is noticeably higher than the fleet average, it might not indicate inefficiency but rather a temporary learning curve. Tools like exception reporting can automatically flag such deviations, helping you focus on what matters.
Driver performance scores should take into account both how often and how severe certain events are.
"Drivers are assigned a performance score based on the severity and frequency of events over a specified period (weekly, monthly, quarterly)."
This scoring system enables targeted coaching, ensuring that feedback is relevant and improvements are meaningful. Use these insights to build a more tailored approach to enhancing fleet operations.
Making Data-Driven Improvements
The next step is to translate the insights from your dashboard into specific actions. Use the data to guide coaching sessions, fine-tune training programmes, and make operational adjustments. Avoid vague or generic feedback - focus on what the data tells you.
Dashboards can also reveal patterns that individual coaching alone may not address. If recurring challenges emerge across the fleet, it might signal a need to revisit your processes or rethink your operational strategies on a broader scale.
Reviewing and Updating Dashboards
Once you've implemented changes, don't let your dashboard become static. Regularly review and update it to keep it aligned with your current goals and any regulatory updates. A quarterly review is a good practice to ensure your metrics and alert settings remain relevant and effective.
"Periodically review the metrics and weightings in your scorecard to ensure they align with evolving business goals, safety standards, and regulatory requirements."
Stay proactive by monitoring regulatory updates that could impact your key performance indicators (KPIs). Additionally, explore enhancements from your telematics provider, such as those from GRS Fleet Telematics, to improve the accuracy and functionality of your dashboards. These updates can help you stay ahead in managing fleet performance effectively.
Benefits of Custom Driver Dashboards
Custom driver dashboards bring a host of advantages to fleet operations in the UK, helping businesses streamline their processes and achieve better results. By focusing on specific business needs, these dashboards allow fleet managers to zero in on the metrics that matter most - whether that’s cutting fuel costs, improving delivery times, or boosting safety performance.
One major advantage is better decision-making. With detailed data at their fingertips, fleet managers can move beyond guesswork. Custom dashboards provide a clear view of performance across drivers, routes, and vehicles, making it easier to spot trends and problem areas. This insight allows for targeted improvements that can positively affect the bottom line. Plus, the detailed data supports better vehicle security and operational control, making fleet management more reliable overall.
Speaking of security, enhanced operational control and safety are standout features. With tools like dual-tracker technology, which boasts a 91% recovery rate, businesses can safeguard their valuable assets. Real-time monitoring tools, such as geofencing alerts, help managers keep a close eye on their vehicles, ensuring they stay secure and on track.
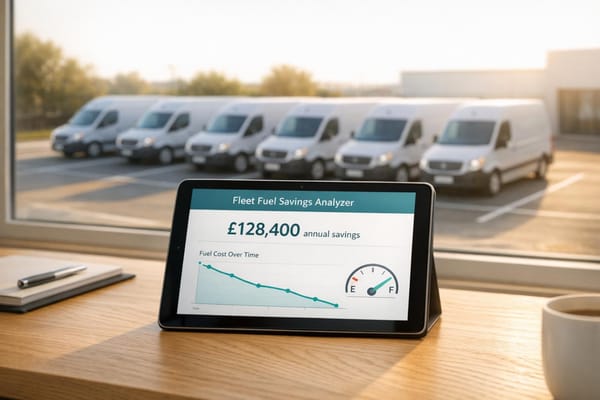
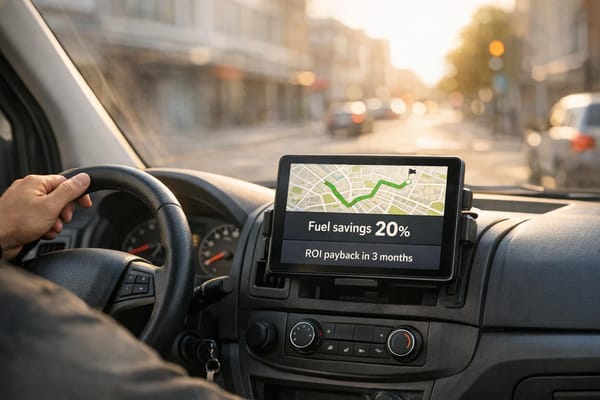
Another key benefit is cutting costs through improved efficiency. Dashboards make it easy to identify areas where savings can be made, such as tracking fuel consumption, pinpointing inefficient vehicles, or adjusting routes to save time and money. By addressing inefficiencies like excessive idling or delays caused by poor route planning, businesses can reduce expenses while continuously improving performance.
For UK companies managing commercial fleets, these dashboards offer a well-rounded solution. They address both the everyday challenges of running a fleet and the bigger picture of strategic planning, making them an invaluable tool for modern fleet management.
FAQs
How can fleet managers organise their data for effective use in customised driver dashboards?
Fleet managers aiming to maximise the benefits of customised driver dashboards should prioritise gathering and organising essential data. This includes metrics like vehicle health, driver performance, fuel usage, and route efficiency. By setting up a structured approach to data collection, they can ensure that these critical metrics are consistently and reliably tracked.
The quality of data is equally important. This involves validating the information, standardising formats, and routinely updating records to maintain accuracy. When data is well-organised into logical categories and integrated in real time, dashboards can deliver meaningful insights. These insights empower managers to make informed, data-driven decisions that enhance overall fleet performance.
What should I consider when selecting a platform for creating custom driver dashboards for my fleet?
When choosing a platform to build custom driver dashboards, there are a few key factors to keep in mind: scalability, data tracking features, and integration capabilities. A good platform should offer detailed insights into critical metrics such as vehicle location, maintenance schedules, driver habits, and fuel usage. These insights can play a huge role in keeping your fleet running smoothly and efficiently.
It's also important to ensure the platform can adapt to your business's growth. For example, as electric vehicles become more common, you'll want a system that can handle EV-specific data and advanced analytics. Additionally, seamless integration with your current systems is crucial for smooth operations and easy data sharing. The right platform can help you streamline fleet management and make smarter, data-driven decisions.
How can custom driver dashboards help fleet managers enhance efficiency and cut costs?
Custom driver dashboards give fleet managers real-time insights into crucial aspects like vehicle locations, driver behaviour, and overall operational performance. These tools make it easier to streamline routes, enhance driver efficiency, and keep daily operations running more smoothly.
With this information at hand, businesses can cut costs by focusing on smarter fuel usage, scheduling maintenance ahead of time, and staying aligned with safety regulations. The result? Lower running expenses and a noticeable boost in fleet productivity.